Fig. 2.
Download original image
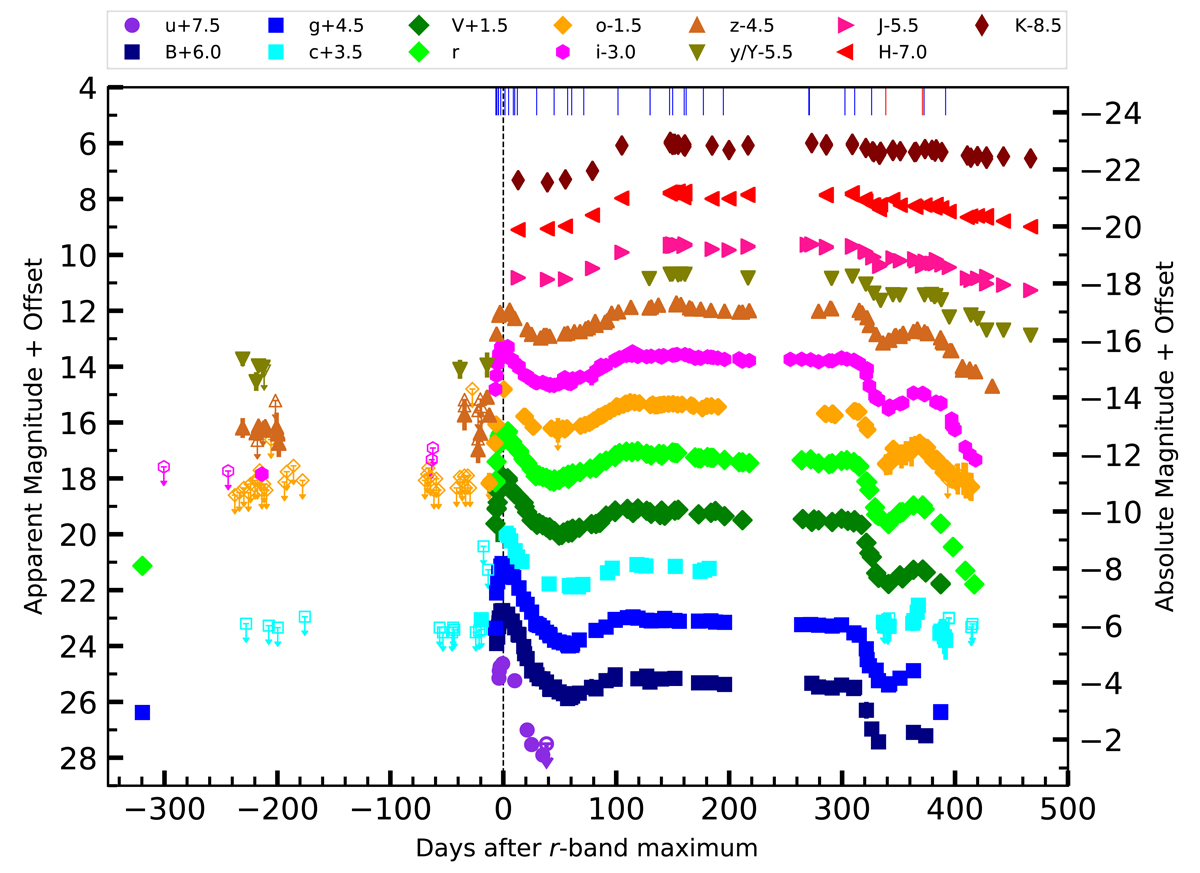
Multiband light curves of AT 2021biy. The dashed vertical line indicates the r-band maximum light as the reference epoch. The epochs of our optical spectra are marked with vertical blue solid lines, while the two epochs of NIR spectra are indicated with vertical red solid lines. Upper limits are marked by empty symbols with downward-pointing arrows. For clarity, individual-band light curves are shifted with arbitrary constants reported in the legend. In most cases, the data-point uncertainties are smaller than the plotted symbols.
Current usage metrics show cumulative count of Article Views (full-text article views including HTML views, PDF and ePub downloads, according to the available data) and Abstracts Views on Vision4Press platform.
Data correspond to usage on the plateform after 2015. The current usage metrics is available 48-96 hours after online publication and is updated daily on week days.
Initial download of the metrics may take a while.