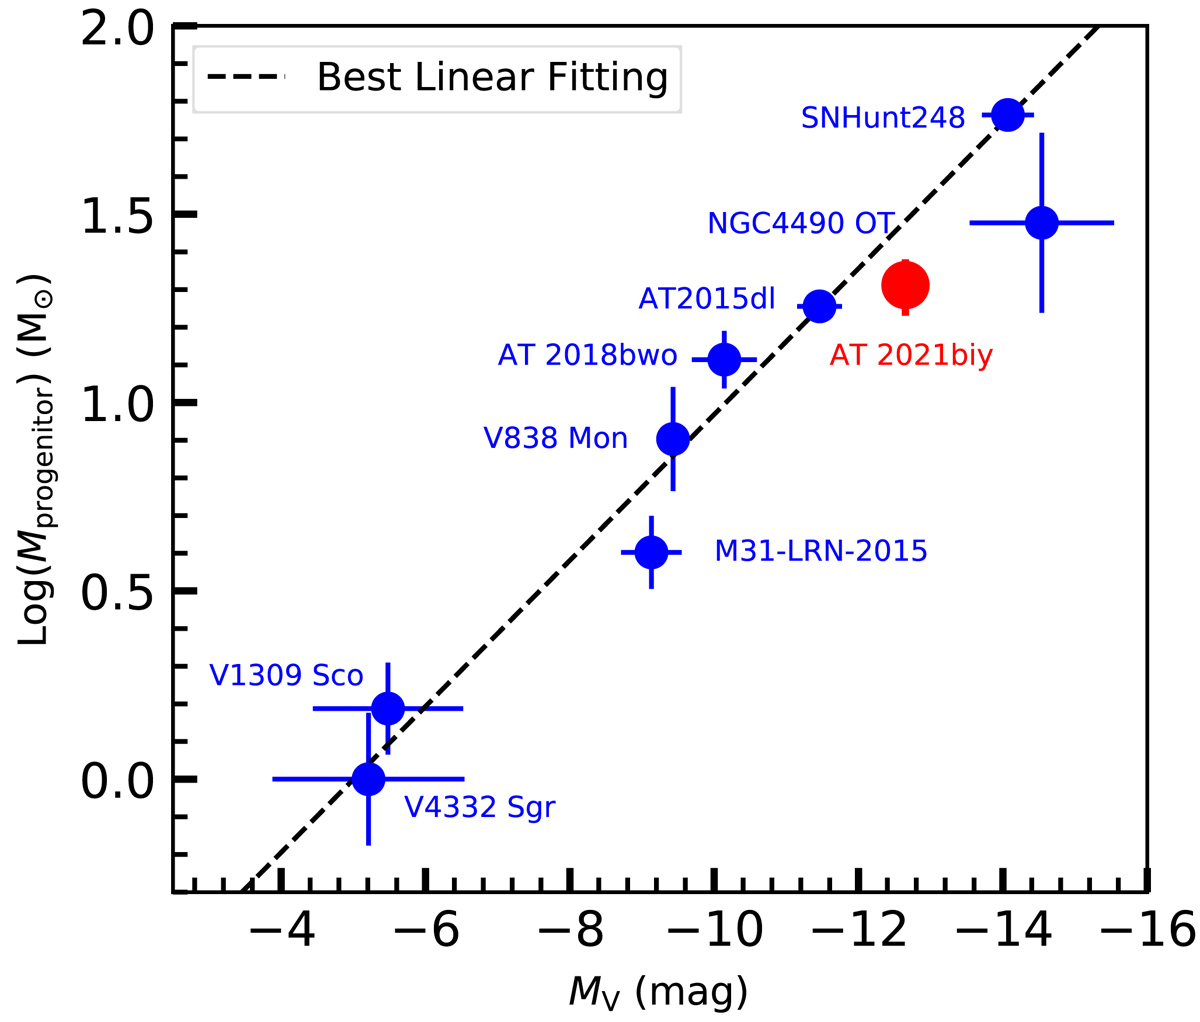
Fig. 14.
Download original image
Diagram of progenitor mass (log (Mprogenitor)) versus V-band second peak (or plateau) magnitude (MV). Blue dots represent data from the literature, while the red point marks the location of AT 2021biy. The linear best fit to the data is shown as a dashed line. Data for LRNe are from from the literature (Martini et al. 1999; Munari et al. 2002; Mason et al. 2010; Tylenda et al. 2011; Kankare et al. 2015; Mauerhan et al. 2015; Williams et al. 2015; Smith et al. 2016; Blagorodnova et al. 2017, 2021; Kamiński et al. 2018; Pastorello et al. 2019b; Ortiz-León et al. 2020).
Current usage metrics show cumulative count of Article Views (full-text article views including HTML views, PDF and ePub downloads, according to the available data) and Abstracts Views on Vision4Press platform.
Data correspond to usage on the plateform after 2015. The current usage metrics is available 48-96 hours after online publication and is updated daily on week days.
Initial download of the metrics may take a while.