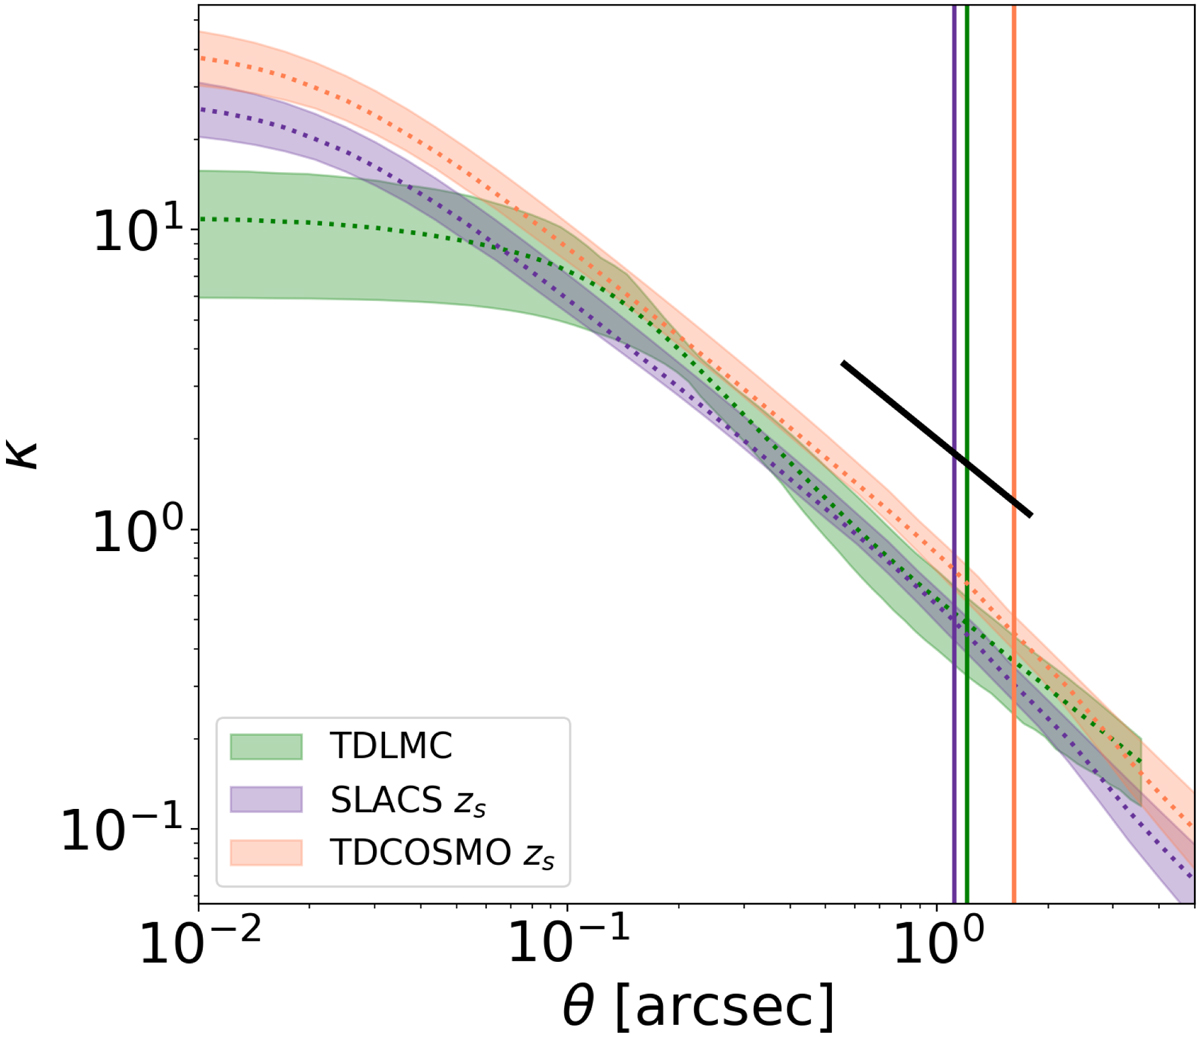
Fig. 4.
Download original image
Convergence profiles for 20 analytical Chameleon+NFW profiles used in this paper (purple: SLACS-like; orange: TDCOSMO-like) alongside 16 profiles from hydro-simulations used in the TDLMC (green). Colored bands correspond to the 16th and 84th percentiles. Vertical colored lines indicate the median Einstein radius of the corresponding population. The diagonal black line indicates an isothermal slope for comparison.
Current usage metrics show cumulative count of Article Views (full-text article views including HTML views, PDF and ePub downloads, according to the available data) and Abstracts Views on Vision4Press platform.
Data correspond to usage on the plateform after 2015. The current usage metrics is available 48-96 hours after online publication and is updated daily on week days.
Initial download of the metrics may take a while.