Fig. 2.
Download original image
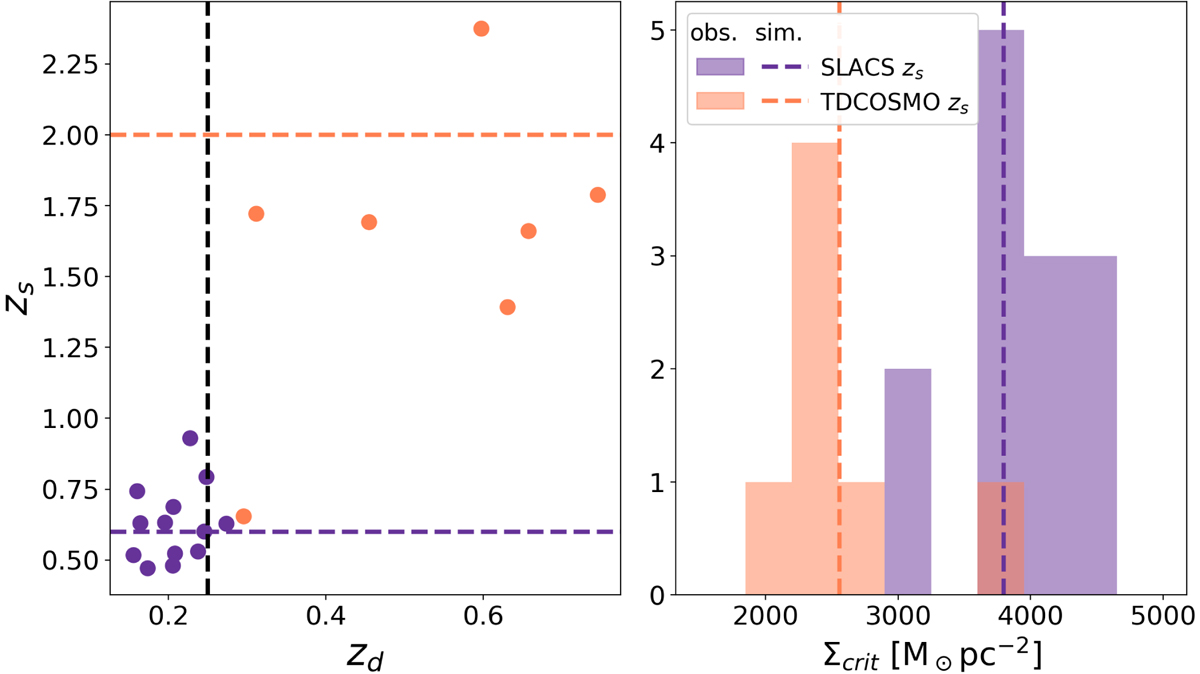
Redshift comparison with the observed lens population. Left: the distributions of source redshifts against lens redshifts for the populations of observed SLACS (purple) and TDCOSMO (orange) lenses. Our selections of source and lens redshifts are indicated as dashed lines. Right: these selections result in the dashed-line Σcrit values, which are consistent with the observed populations.
Current usage metrics show cumulative count of Article Views (full-text article views including HTML views, PDF and ePub downloads, according to the available data) and Abstracts Views on Vision4Press platform.
Data correspond to usage on the plateform after 2015. The current usage metrics is available 48-96 hours after online publication and is updated daily on week days.
Initial download of the metrics may take a while.