Fig. 7
Download original image
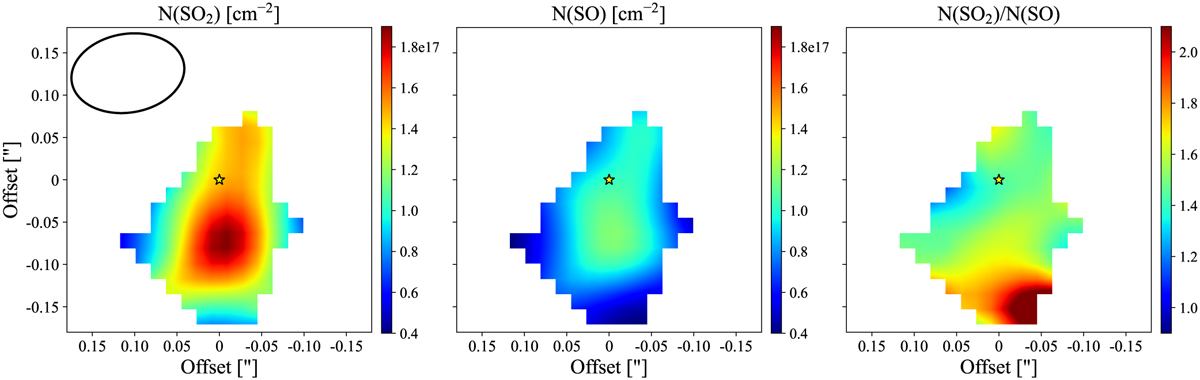
Column densities. Left: SO2 column density obtained from the rotational diagram method. The synthesized beam is shown by the black ellipse in the upper left corner. Center: SO column density, assuming optically thin emission and employing the rotational temperatures from Fig. 6. Right: column density ratio of SO2 to SO. The yellow star indicates the position of the source.
Current usage metrics show cumulative count of Article Views (full-text article views including HTML views, PDF and ePub downloads, according to the available data) and Abstracts Views on Vision4Press platform.
Data correspond to usage on the plateform after 2015. The current usage metrics is available 48-96 hours after online publication and is updated daily on week days.
Initial download of the metrics may take a while.