Fig. 5
Download original image
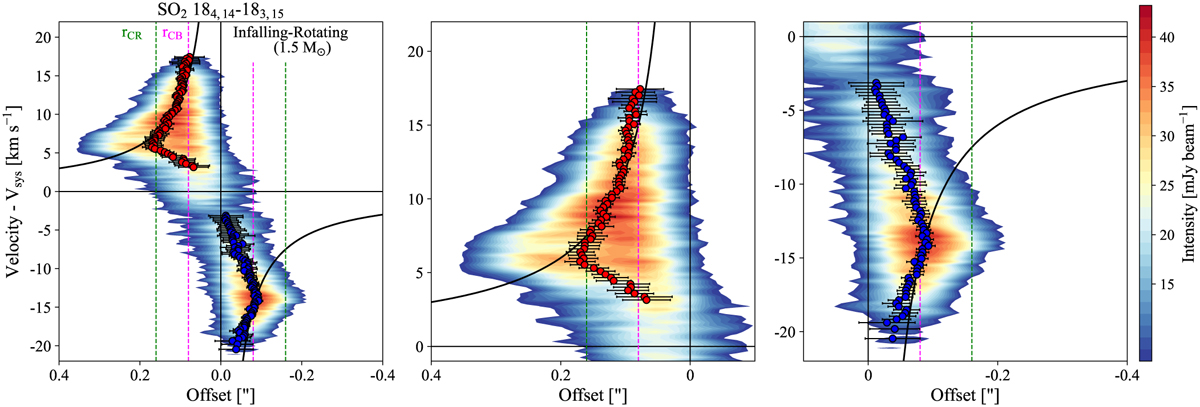
Position-velocity diagram for SO2 184,14–183,15. Left: emission above 3σ% employing a PA of 157°. The blue and red dots represent blue- and redshifted emission peaks above ±3 km s−1, respectively. The black line represents an infalling-rotating profile with M* = 1.5 M⊙, an inclination of 70°, and rCB = 0708 (magenta dashed lines). The rCR is shown by the green dashed lies. Center: zoomed-in version for the redshifted emission. Right: zoomed-in version for the blueshifted emission. The systemic velocity is 3.7 km s−1.
Current usage metrics show cumulative count of Article Views (full-text article views including HTML views, PDF and ePub downloads, according to the available data) and Abstracts Views on Vision4Press platform.
Data correspond to usage on the plateform after 2015. The current usage metrics is available 48-96 hours after online publication and is updated daily on week days.
Initial download of the metrics may take a while.