Fig. 2
Download original image
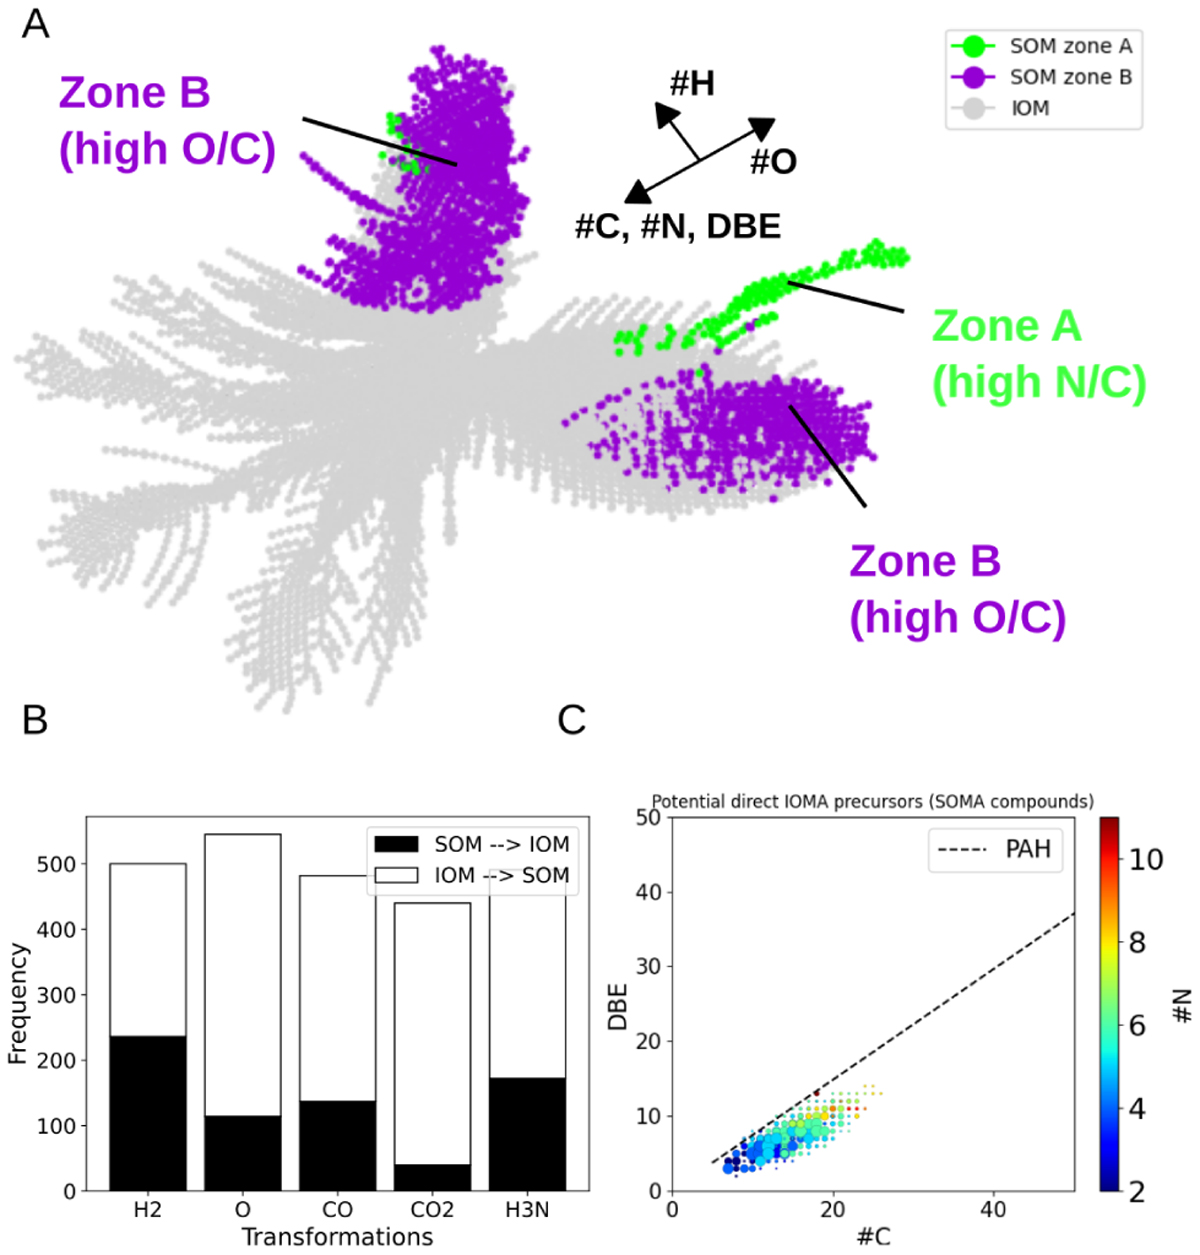
Molecular network identifying possible connection between SOMA and IOMA. (A) One component that represents 70% of SOMA–IOMA attributions displays a connection between SOMA and IOMA. The gray nodes represent the IOMA attributions. (B) Frequencies related to edges H2, O, CO, CO2, and NH3 are reported and set as SOMA-to-IOMA or IOMA-to-SOMA transitions. (C) SOMA attributions that are directly connected to IOMA ones were extracted and represented as DBE versus #C. These compounds can be considered as direct IOMA precursors.
Current usage metrics show cumulative count of Article Views (full-text article views including HTML views, PDF and ePub downloads, according to the available data) and Abstracts Views on Vision4Press platform.
Data correspond to usage on the plateform after 2015. The current usage metrics is available 48-96 hours after online publication and is updated daily on week days.
Initial download of the metrics may take a while.