Fig. 1
Download original image
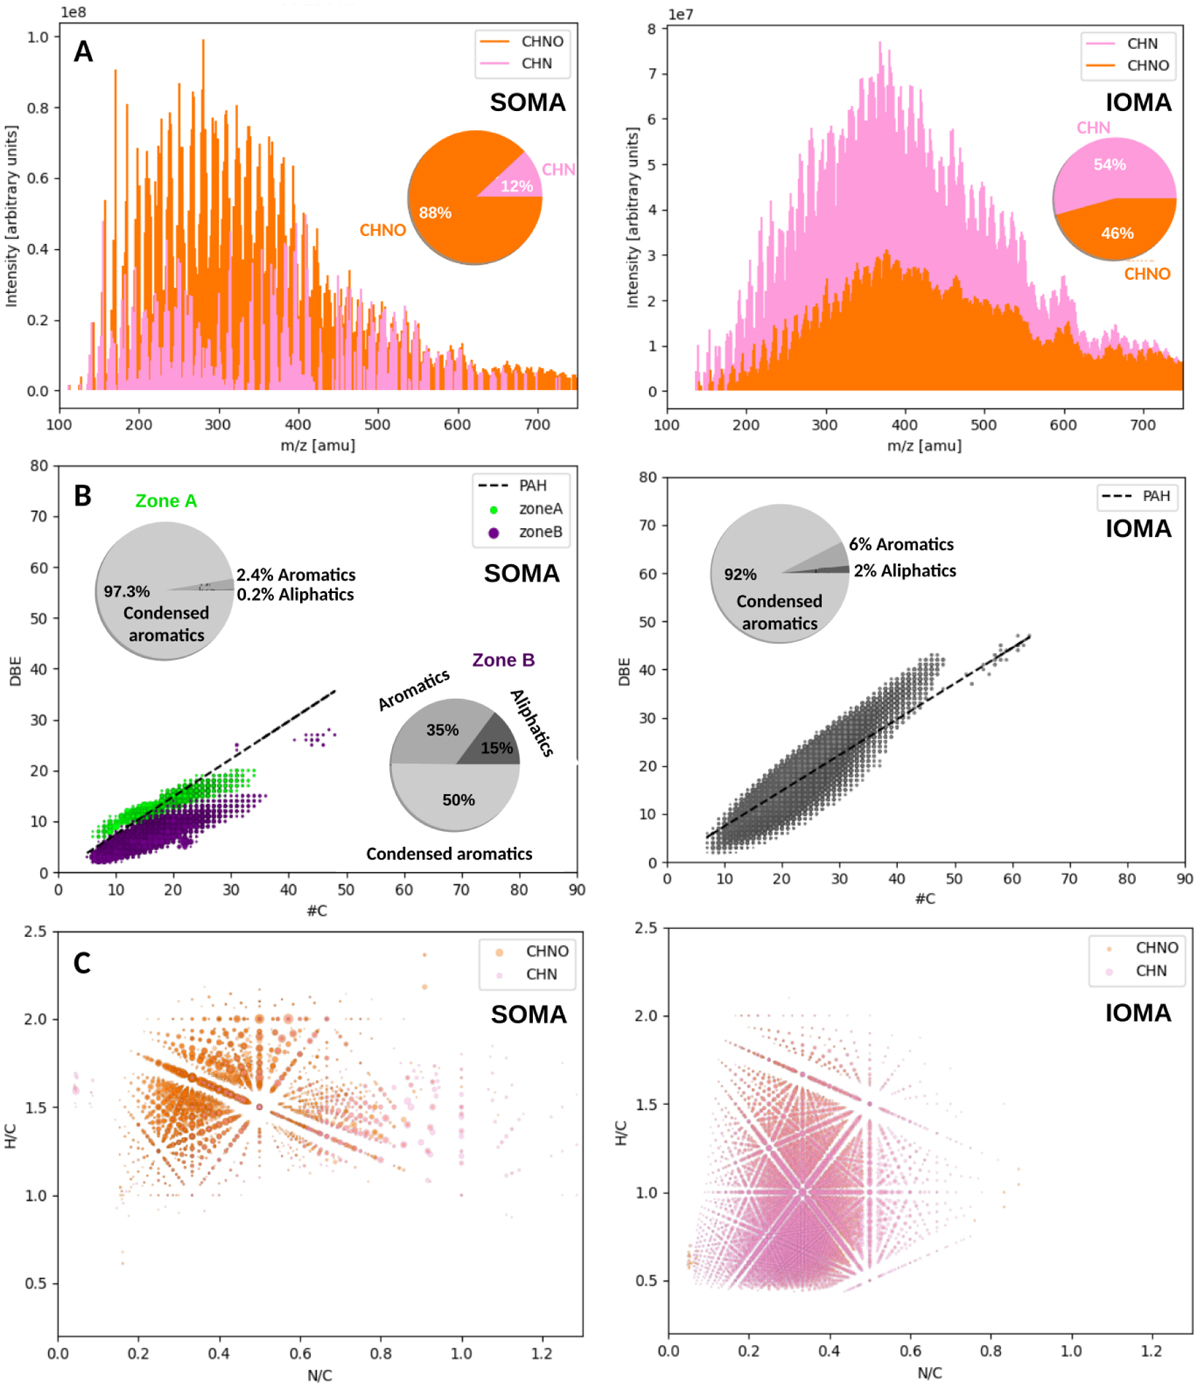
SOMA versus IOMA. (A) Laser desorption ionization FT-ICR mass spectra of analogues of soluble (SOMA, 3756 attributions) and insoluble (IOMA, 9738 attributions) organic matter. Pie charts display the repartition of molecular groups observed (CHNO, CHN) in SOMA and IOMA. (B) Representations of double-bond equivalent (DBE) versus the number of carbon (#C) for each molecular formula identified in SOMA and IOMA, with the dotted line indicating the PAH trend. Also displayed are the two different zones of the SOMA (Zone A in green and Zone B in purple). XC pie chart of SOMA (m = 0.5) and IOMA (m = 0.75) data are also reported showing attribution repartitions between aliphatic, aromatic and condensed aromatic structures. m corresponds to the proportion of O atoms included in double bonds. (C) Van Krevelen diagrams H/C versus N/C for SOMA and IOMA.
Current usage metrics show cumulative count of Article Views (full-text article views including HTML views, PDF and ePub downloads, according to the available data) and Abstracts Views on Vision4Press platform.
Data correspond to usage on the plateform after 2015. The current usage metrics is available 48-96 hours after online publication and is updated daily on week days.
Initial download of the metrics may take a while.