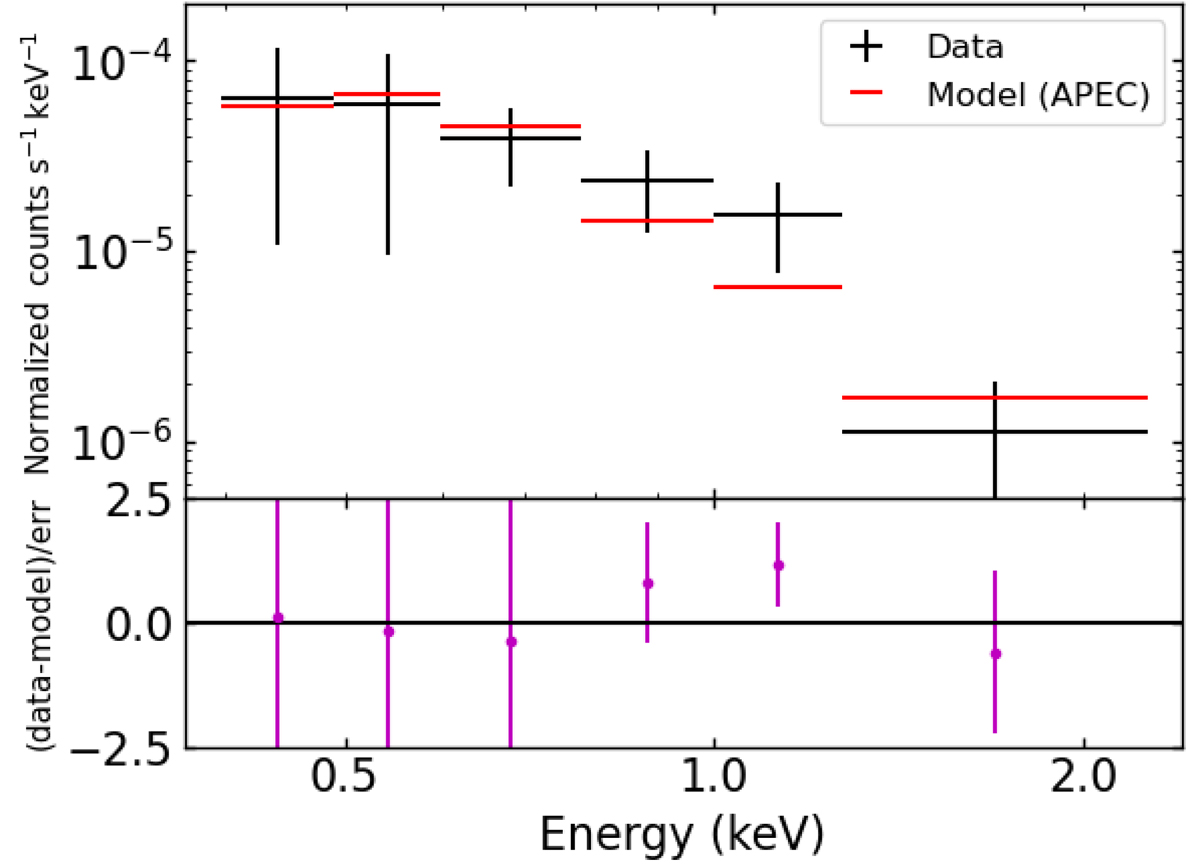
Fig. A.1.
Download original image
X-ray spectrum at the core of the 463 filaments using the source mask with the radius of 60 arcsec. In the top panel, black crosses show excesses of X-ray emission at the core of the 463 filaments (< 2.5 Mpc from the filament spines), relative to the background (average X-ray signal at 10−20 Mpc from the filament spines) at the six energy bands when we use the source mask with the radius of 60 arcsec. The line width expresses their uncertainties. The 1σ uncertainties are estimated by a bootstrap resampling. Red lines are fit to the data with the APEC model. In the bottom panel, the magenta points show the ratio of the data and model at each energy band.
Current usage metrics show cumulative count of Article Views (full-text article views including HTML views, PDF and ePub downloads, according to the available data) and Abstracts Views on Vision4Press platform.
Data correspond to usage on the plateform after 2015. The current usage metrics is available 48-96 hours after online publication and is updated daily on week days.
Initial download of the metrics may take a while.