Fig. 3.
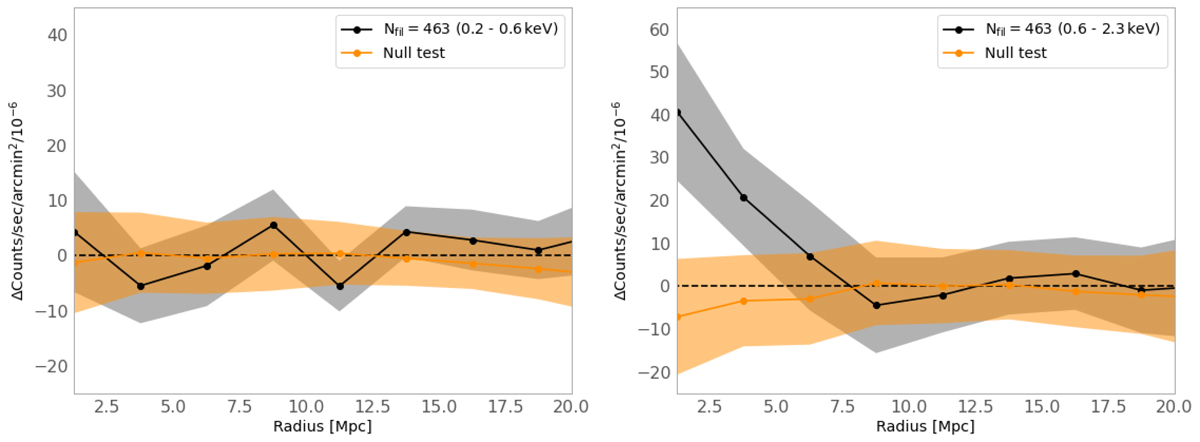
Download original image
Average radial X-ray profile of the 463 filaments. The black lines are the ones at 0.2−0.6 keV in the left panel and at 0.6−2.3 keV in the right panel. The 1σ uncertainty is estimated by a bootstrap resampling, shown as the gray strip. The average and standard deviation from the 1000 null-test profiles are shown as the orange line and strip, respectively.
Current usage metrics show cumulative count of Article Views (full-text article views including HTML views, PDF and ePub downloads, according to the available data) and Abstracts Views on Vision4Press platform.
Data correspond to usage on the plateform after 2015. The current usage metrics is available 48-96 hours after online publication and is updated daily on week days.
Initial download of the metrics may take a while.