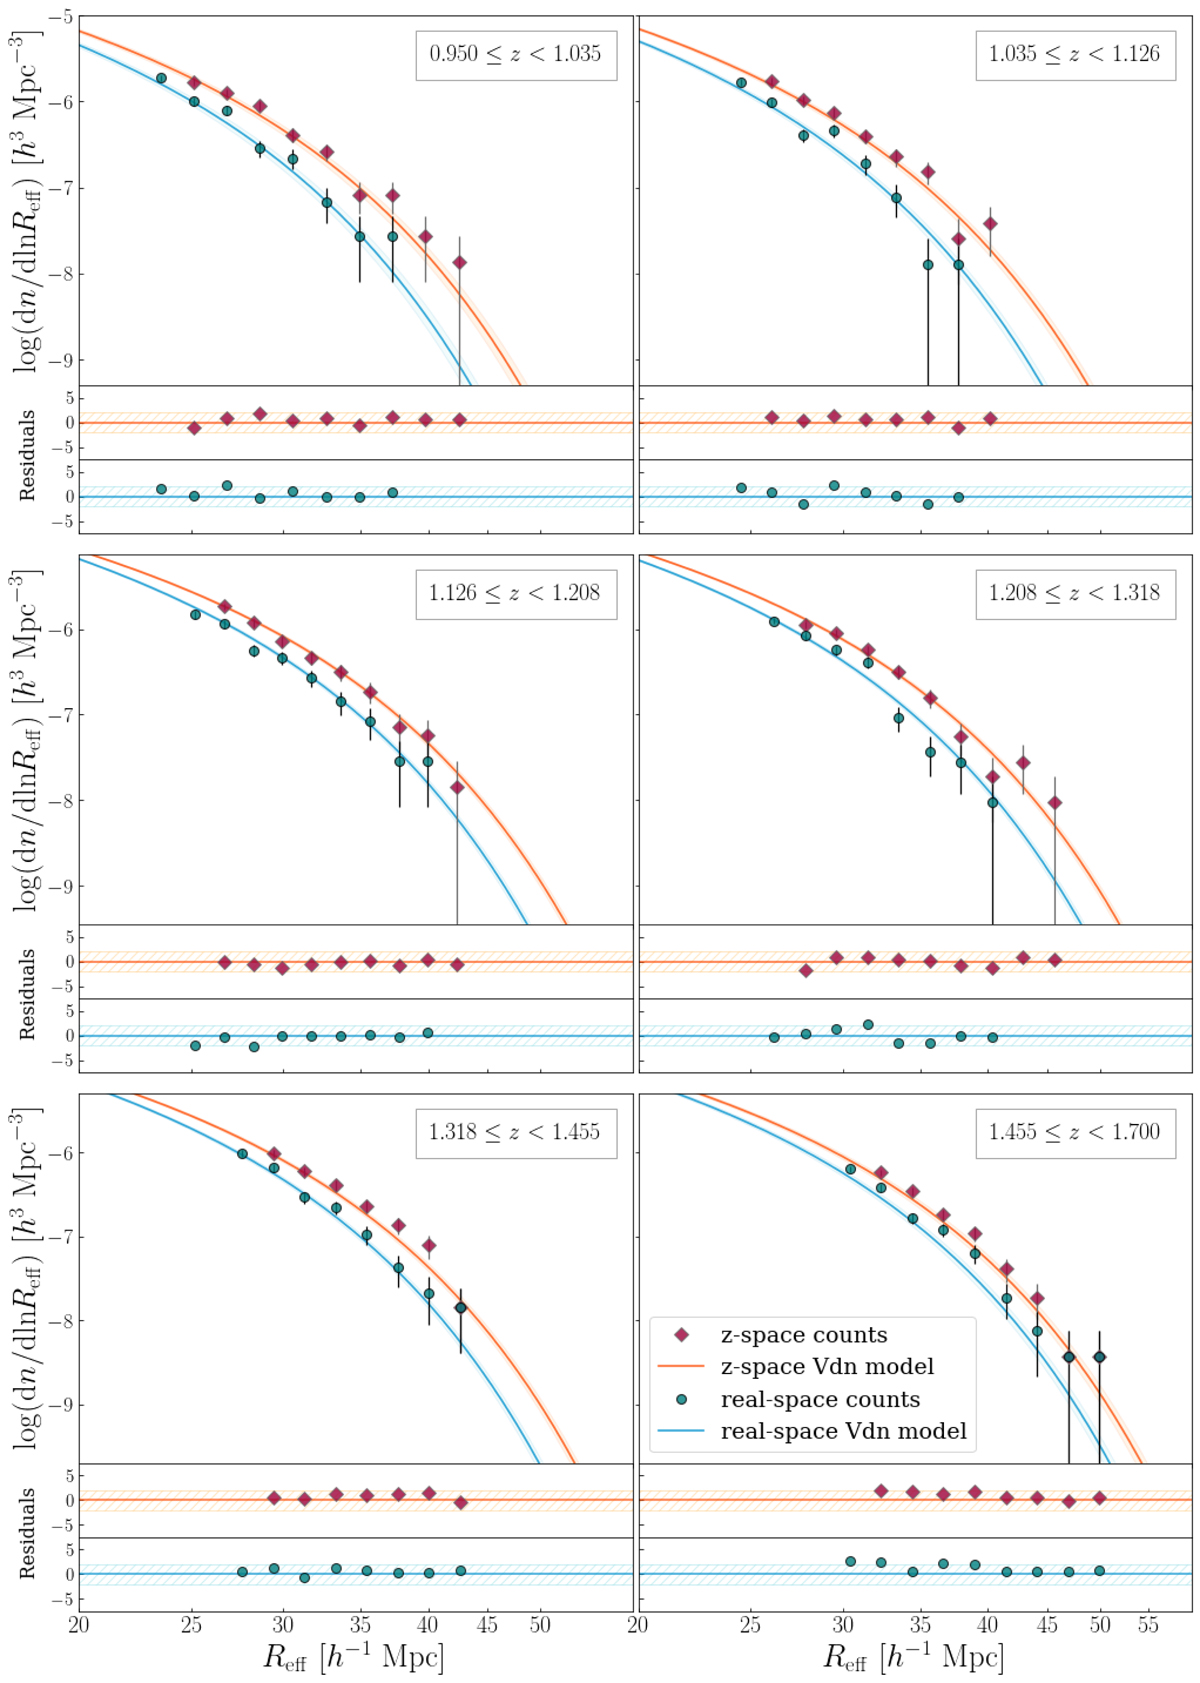
Fig. 3.
Download original image
Comparison between the measured void number counts as a function of Reff (the void radii rescaled by the cleaning algorithm), and the theoretical predictions given by the extended Vdn model, in six different redshift bins. The dark green circles and the dark red diamonds represent the measured void size functions in real and redshift space, respectively, while the corresponding model predictions are depicted in light blue and orange. The shaded regions indicate the uncertainty of 2σ assigned to the model through the calibration of the extended Vdn parameters. Bottom panels: report the residuals computed as the difference of data points from the relative theoretical model, divided by the Poissonian error associated with each data point. The hatched regions represent a band with amplitude 2 useful to check if the data points, considered with a 2σ error, are compatible with the main theoretical curve.
Current usage metrics show cumulative count of Article Views (full-text article views including HTML views, PDF and ePub downloads, according to the available data) and Abstracts Views on Vision4Press platform.
Data correspond to usage on the plateform after 2015. The current usage metrics is available 48-96 hours after online publication and is updated daily on week days.
Initial download of the metrics may take a while.