Open Access
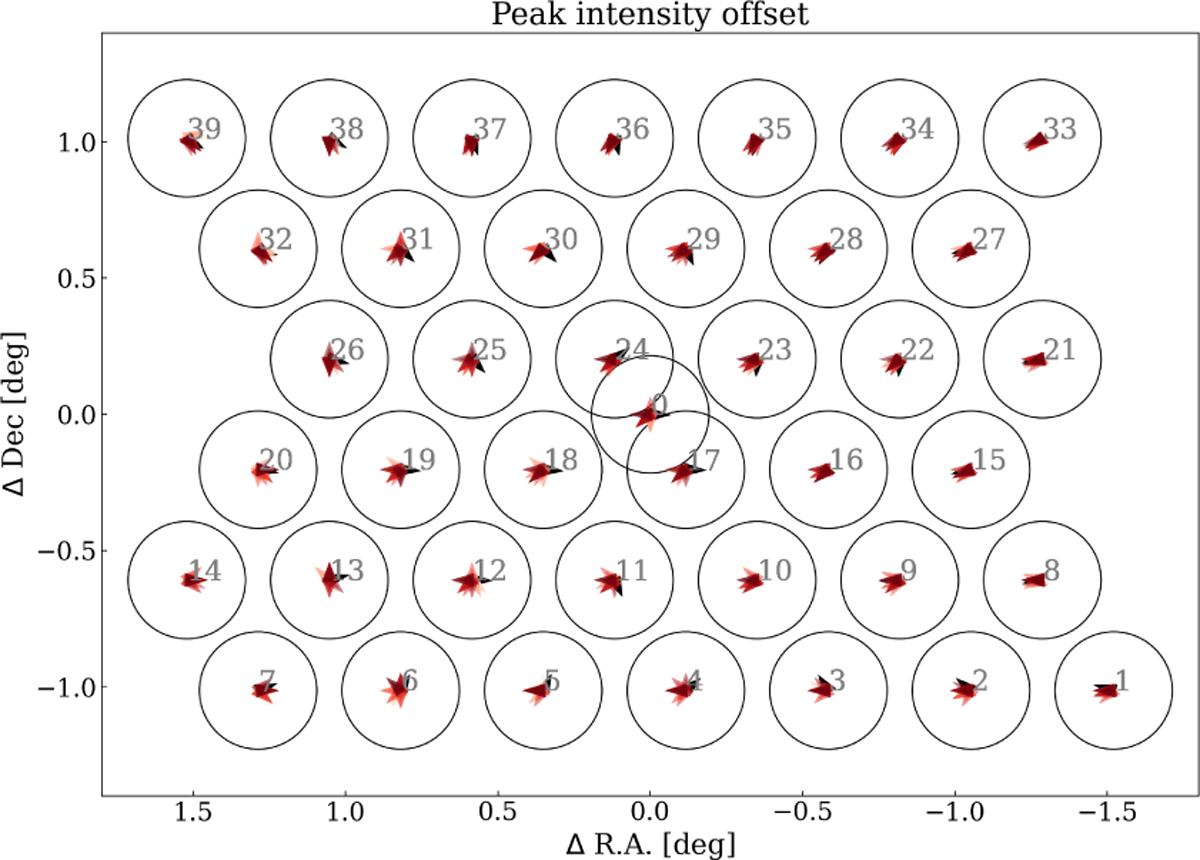
Fig. 8
Download original image
FoV map of peak intensity offset from the centre for each compound beam. The arrowheads show the size (typically a few arcminutes) and the direction of the peak intensity offset. Black arrowheads represent the offset measured from the GP beams and red arrowheads the measurements from the individual drift scans.
Current usage metrics show cumulative count of Article Views (full-text article views including HTML views, PDF and ePub downloads, according to the available data) and Abstracts Views on Vision4Press platform.
Data correspond to usage on the plateform after 2015. The current usage metrics is available 48-96 hours after online publication and is updated daily on week days.
Initial download of the metrics may take a while.