Open Access
Fig. 6
Download original image
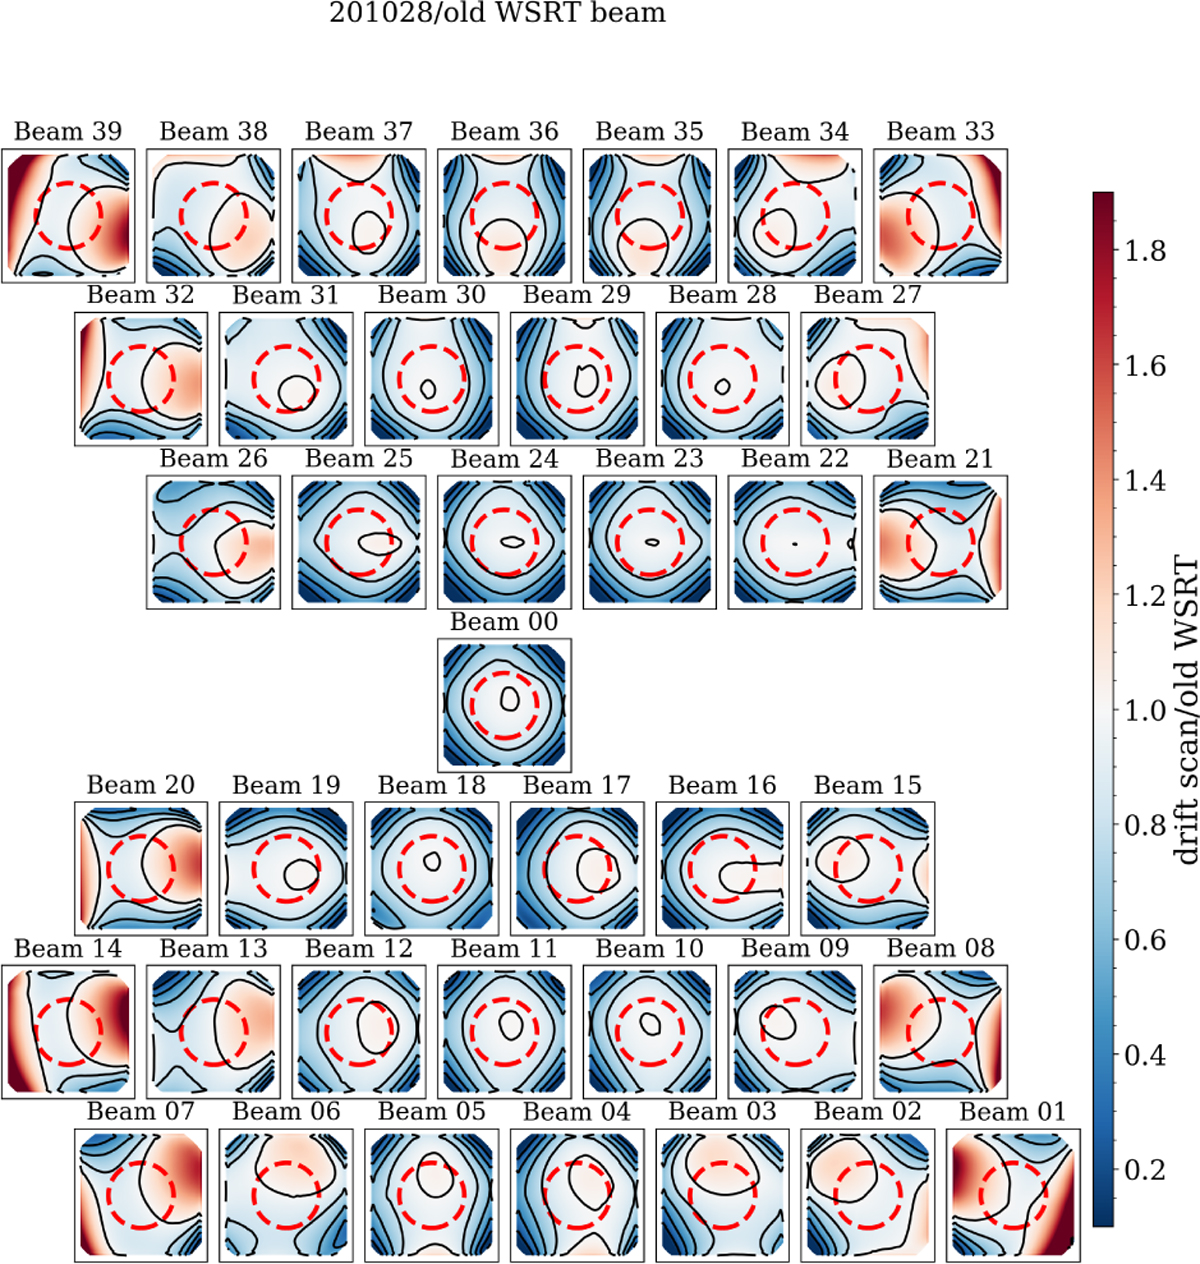
Comparing the CB shapes (201028 data set) to the old WSRT primary beam. The colours show the Apertif beam response divided by the previous analytic WSRT primary beam model. Contours are: 0.2, 0.4, 0.6, 0.8, and 1.0. The red-dashed circle marks 36′ from the centre, which indicates the approximate FWHM for the CBs.
Current usage metrics show cumulative count of Article Views (full-text article views including HTML views, PDF and ePub downloads, according to the available data) and Abstracts Views on Vision4Press platform.
Data correspond to usage on the plateform after 2015. The current usage metrics is available 48-96 hours after online publication and is updated daily on week days.
Initial download of the metrics may take a while.