Fig. 2
Download original image
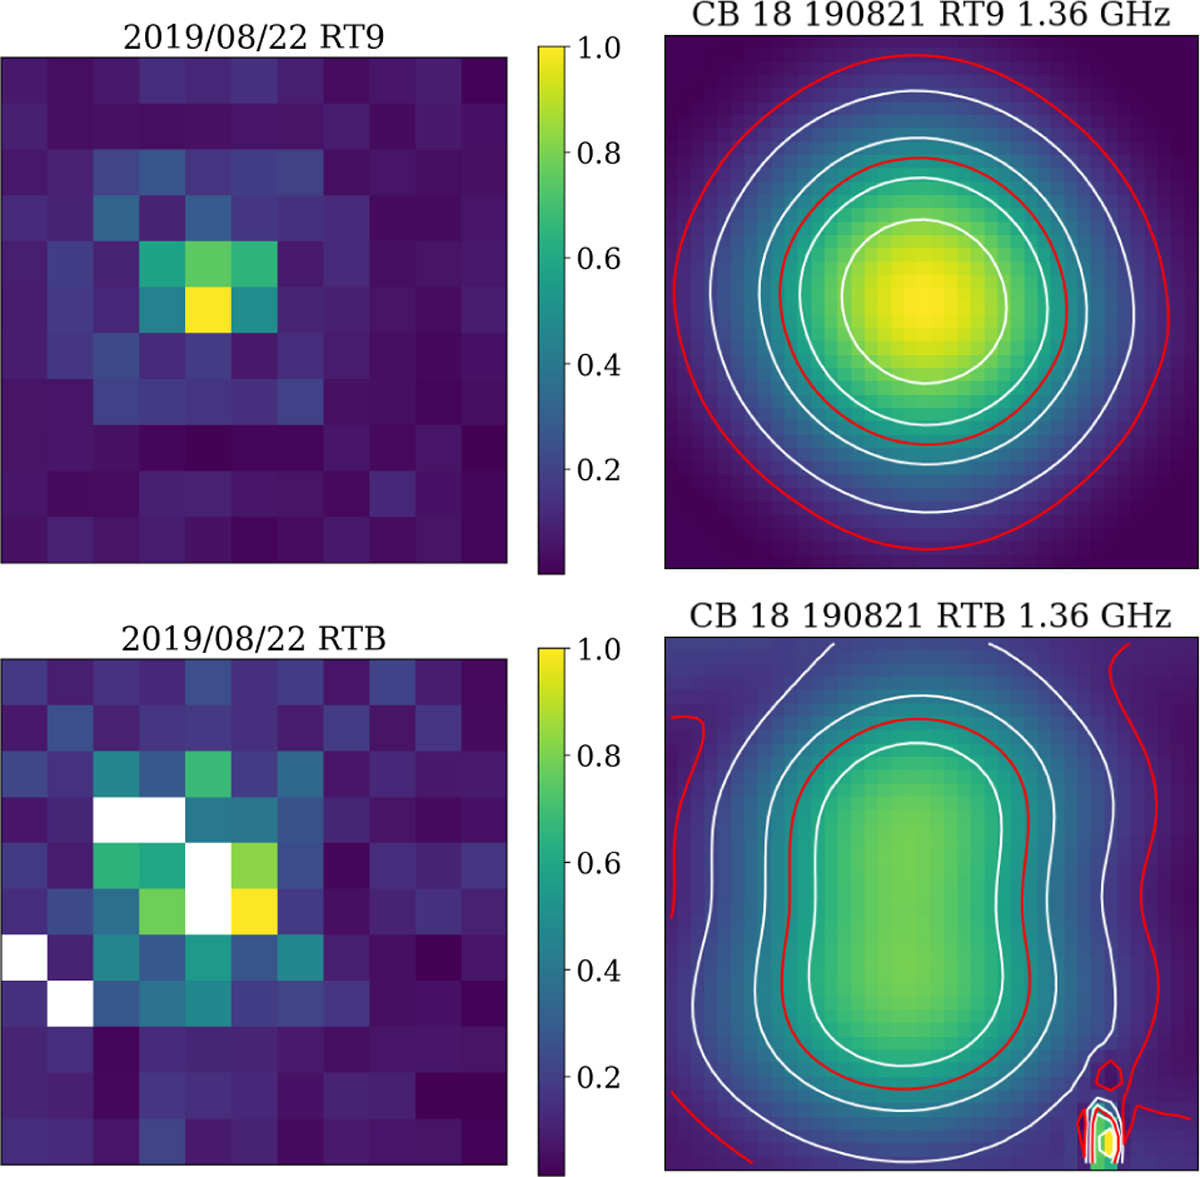
Comparison of beam weights and CB shapes. Left: beam weights for Beam 18 on 2019/08/22 for antenna RT8 (top) and RTB (bottom). Each pixel corresponds to an antenna element on the PAF. Broken elements are white pixels in the image. Right: corresponding CB map from a drift scan measurement. White contour levels are: 0.2, 0.4, 0.6, 0.8. Red contour levels are: 0.1 and 0.5. The colour scale is the same for all four images. Most of the signal for a given beam is contributed by nine antenna elements. If one of these antenna elements is broken, the CB for the given antenna will be distorted. In this case, two of the highest contributing elements on antenna RTB were broken.
Current usage metrics show cumulative count of Article Views (full-text article views including HTML views, PDF and ePub downloads, according to the available data) and Abstracts Views on Vision4Press platform.
Data correspond to usage on the plateform after 2015. The current usage metrics is available 48-96 hours after online publication and is updated daily on week days.
Initial download of the metrics may take a while.