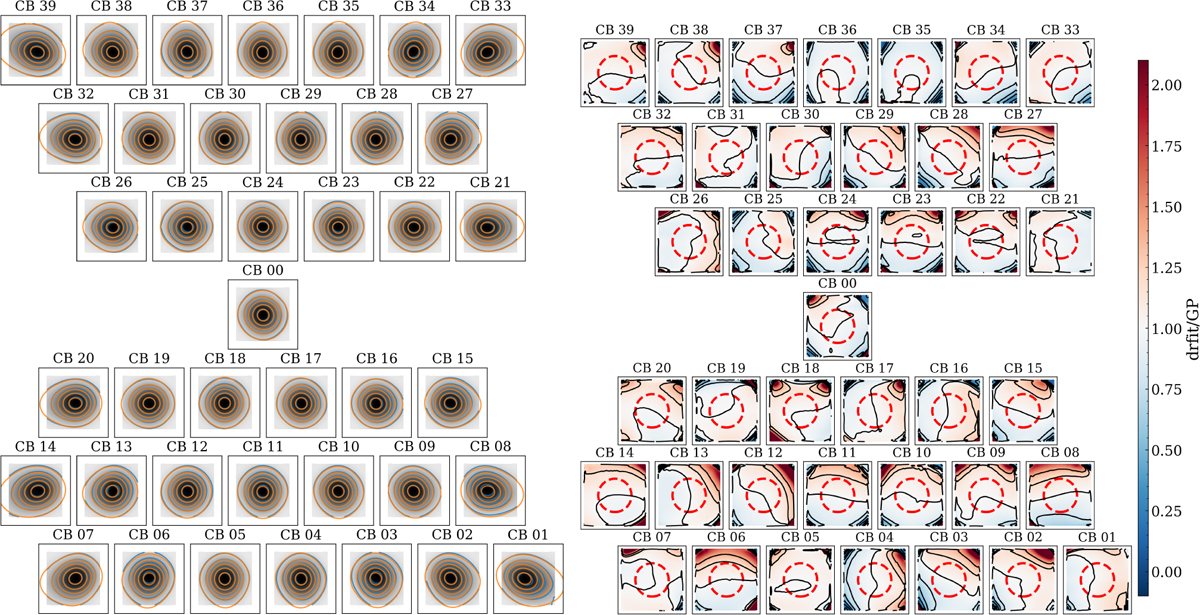
Fig. 13
Download original image
Comparison of drift scan CB maps (201028) with GP CB maps. Left: the grey scale map shows the drift scan CB maps. Blue contours show the drift scan data and orange contours show the GP data. Contour levels are the same for both data sets: 0, 0.1, 0.3, 0.5, 0.7, and 0.9. Right: ratio of drift scan CB maps to GP CB maps. Contours are: 0, 0.2, 0.4, 0.6, 0.8, 1, 1.2, and 1.4. The red dashed circle marks 36′ from the centre, which indicates the approximate FWHM for the beams.
Current usage metrics show cumulative count of Article Views (full-text article views including HTML views, PDF and ePub downloads, according to the available data) and Abstracts Views on Vision4Press platform.
Data correspond to usage on the plateform after 2015. The current usage metrics is available 48-96 hours after online publication and is updated daily on week days.
Initial download of the metrics may take a while.