Open Access
Fig. 11
Download original image
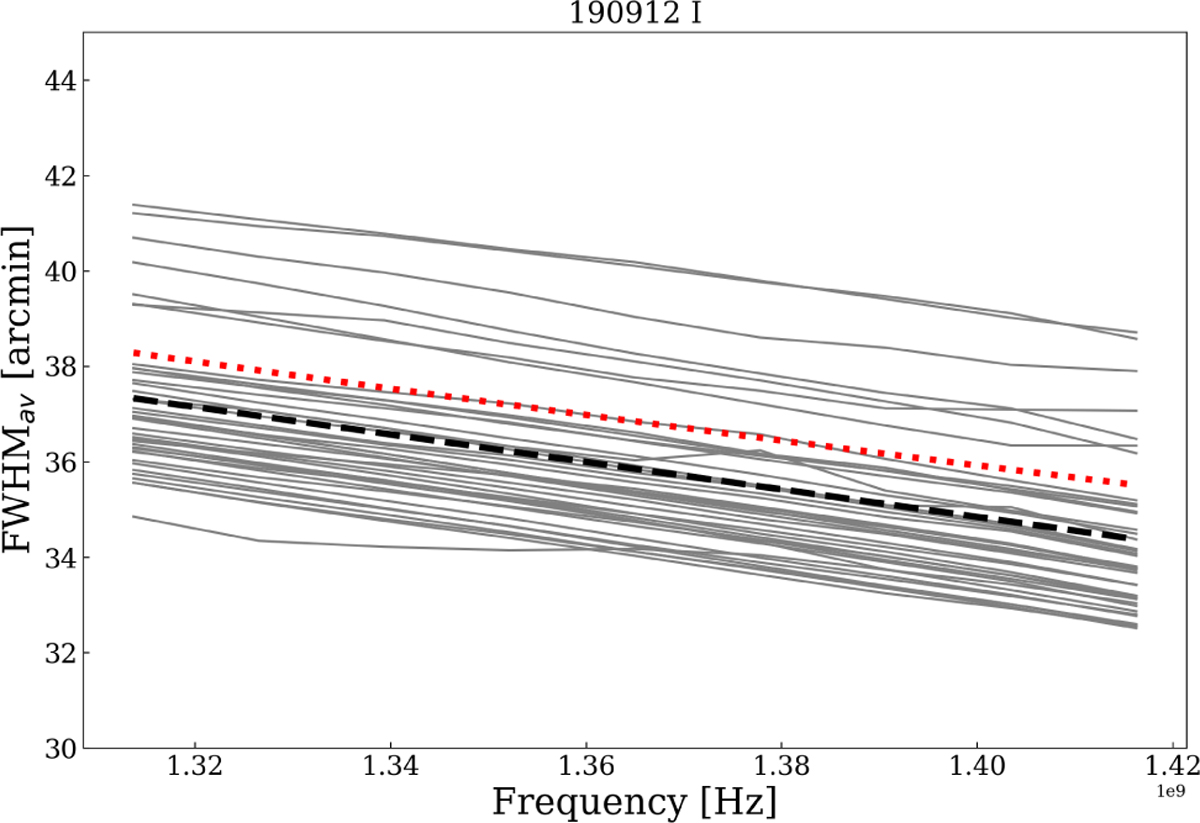
FWHM of CBs as a function of frequency bins. The grey lines show the average FWHM from the 2D Gaussian fit to the I polarisation data of each CB for the data set 190912, while the dashed black line shows the average fitted line and the red dotted line shows the theoretical expectation.
Current usage metrics show cumulative count of Article Views (full-text article views including HTML views, PDF and ePub downloads, according to the available data) and Abstracts Views on Vision4Press platform.
Data correspond to usage on the plateform after 2015. The current usage metrics is available 48-96 hours after online publication and is updated daily on week days.
Initial download of the metrics may take a while.