Open Access
Fig. 10
Download original image
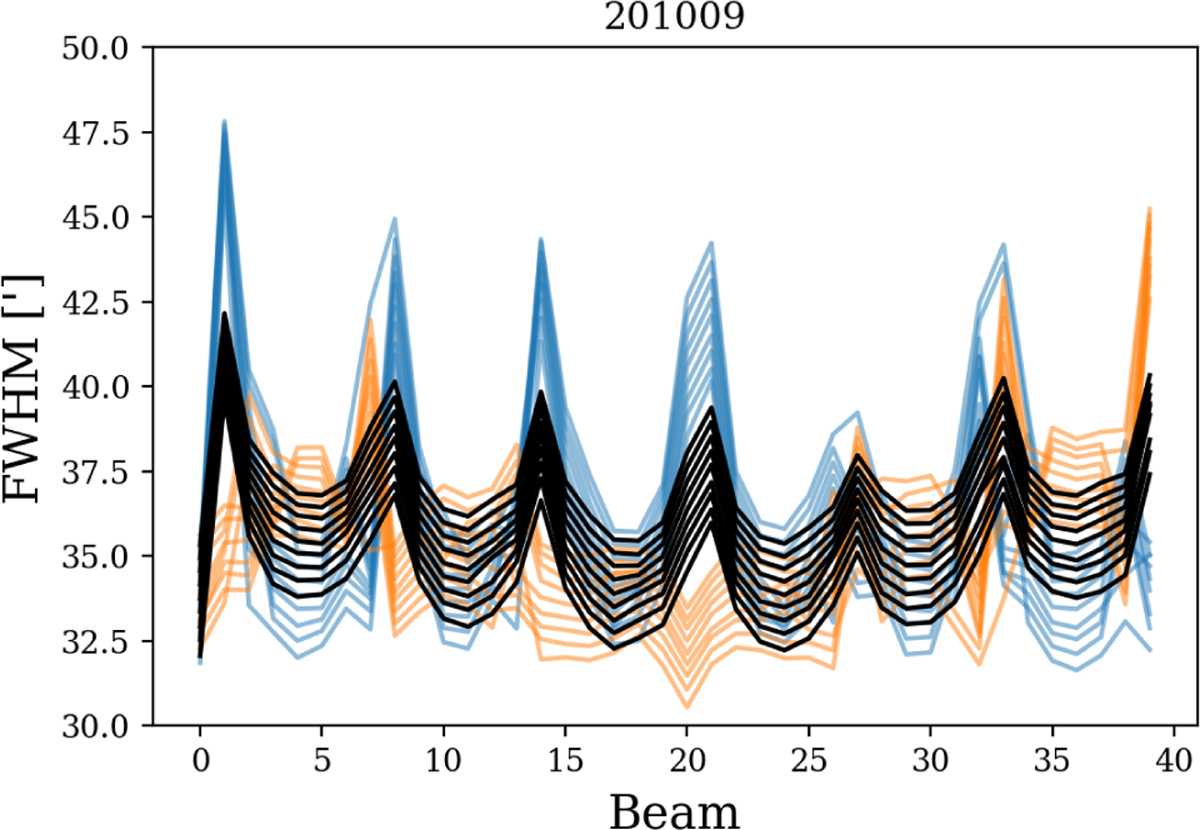
FWHM variation for the 40 CBs. FWHMs are measured by fitting a 2D Gaussian to the beam maps. Blue and orange lines show the FWHM measured along the vertical and horizontal axis and the black line shows the average of the two. There is a line representing each frequency bin for the 201009 data set.
Current usage metrics show cumulative count of Article Views (full-text article views including HTML views, PDF and ePub downloads, according to the available data) and Abstracts Views on Vision4Press platform.
Data correspond to usage on the plateform after 2015. The current usage metrics is available 48-96 hours after online publication and is updated daily on week days.
Initial download of the metrics may take a while.