Fig. 1
Download original image
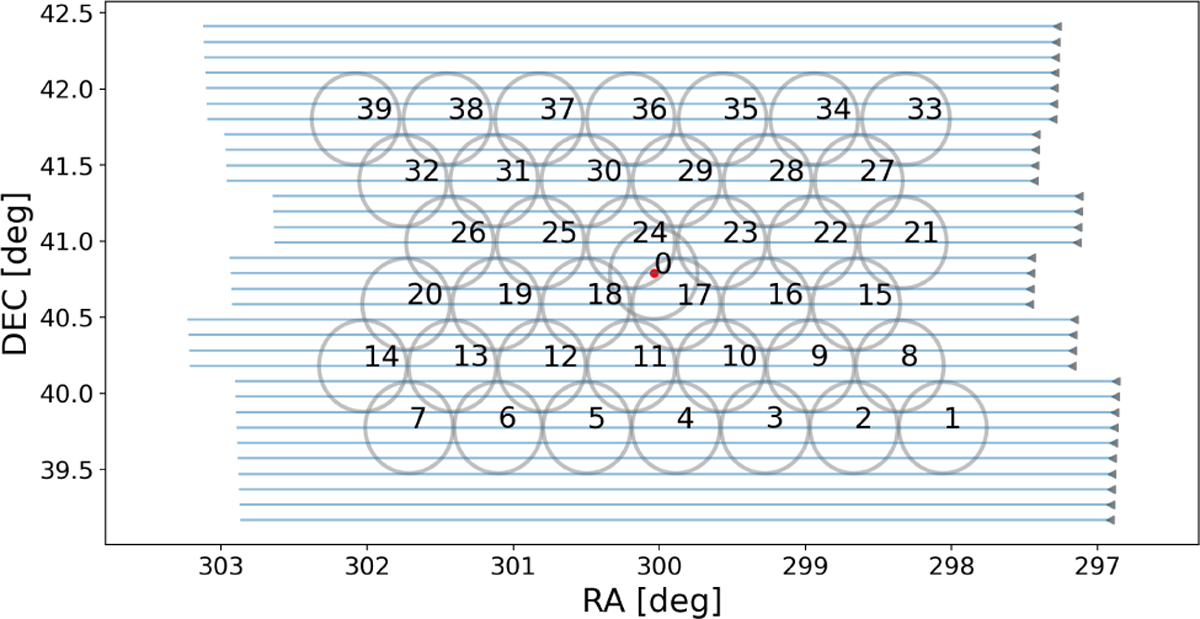
Illustration of drift scan observations. The red dot represents the centre of the PAF at the position of CygA. The numbered circles represent the positions of the 40 CBs (the diameter of the circles is 0.6 deg). The blue lines represent the 33 individual drifts across the field of view of the Apertif footprint, where the grey triangles mark the starting position of each individual drift.
Current usage metrics show cumulative count of Article Views (full-text article views including HTML views, PDF and ePub downloads, according to the available data) and Abstracts Views on Vision4Press platform.
Data correspond to usage on the plateform after 2015. The current usage metrics is available 48-96 hours after online publication and is updated daily on week days.
Initial download of the metrics may take a while.