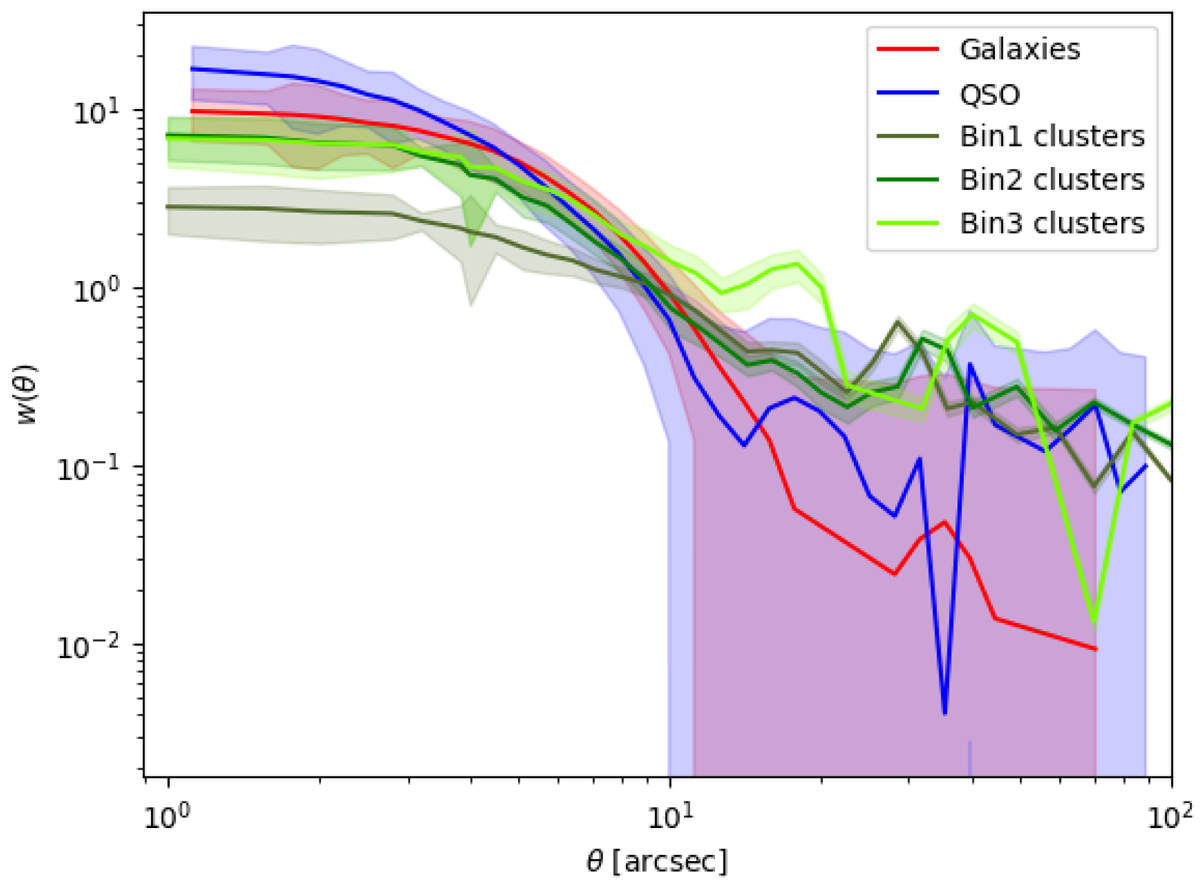
Fig. 7.
Download original image
Comparison of the different stacking results by means of continuous lines with their corresponding error bands. The stacking results obtained in this work are shown in blue for the case of QSOs and in red for the galaxy sample. Such results are compared to the cross-correlation data obtained in Fernandez et al. (2022), where the galaxy clusters are acting as lenses: in particular, the BIN 1 case is shown in dark green, BIN 2 in green, and BIN 3 in light green, corresponding to the 12–17, 18–25, and 26–40 richness intervals, respectively.
Current usage metrics show cumulative count of Article Views (full-text article views including HTML views, PDF and ePub downloads, according to the available data) and Abstracts Views on Vision4Press platform.
Data correspond to usage on the plateform after 2015. The current usage metrics is available 48-96 hours after online publication and is updated daily on week days.
Initial download of the metrics may take a while.