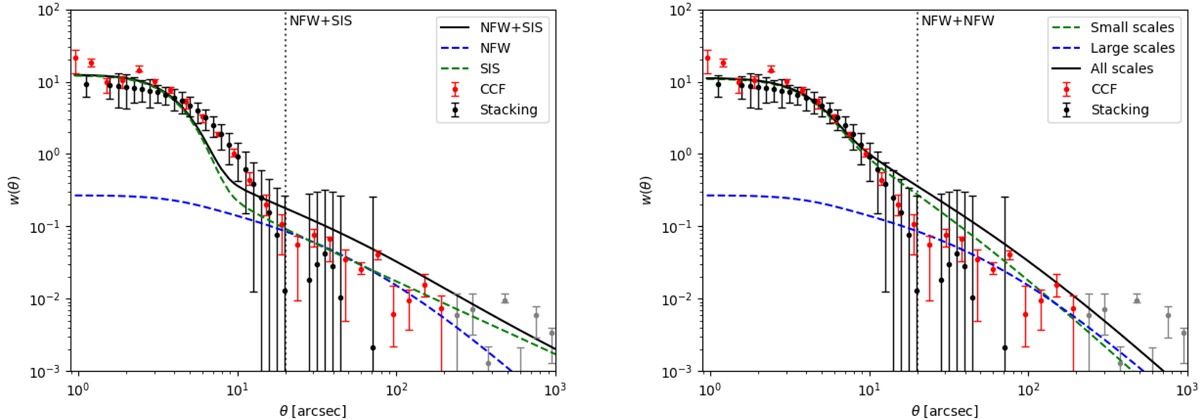
Fig. 6.
Download original image
Stacking data (black points) and those of the cross-correlation function (red points) computed using the galaxies acting as lenses as in González-Nuevo et al. (2017). On the left, the black line represents the NFW+SIS fits, where the corresponding SIS (green dashed line) and NFW (blue dashed line) fits are also shown separately. In the same way, on the right, the NFW+NFW profile is represented with the black line. In this case, the green and blue dashed lines correspond to the fits to the points at the small scales only and large scale only, respectively. The grey dashed vertical line at ∼20 arcsec represents the separation between small and large scales. Grey points are considered outliers and are not taken into account for the analysis.
Current usage metrics show cumulative count of Article Views (full-text article views including HTML views, PDF and ePub downloads, according to the available data) and Abstracts Views on Vision4Press platform.
Data correspond to usage on the plateform after 2015. The current usage metrics is available 48-96 hours after online publication and is updated daily on week days.
Initial download of the metrics may take a while.