Fig. 9
Download original image
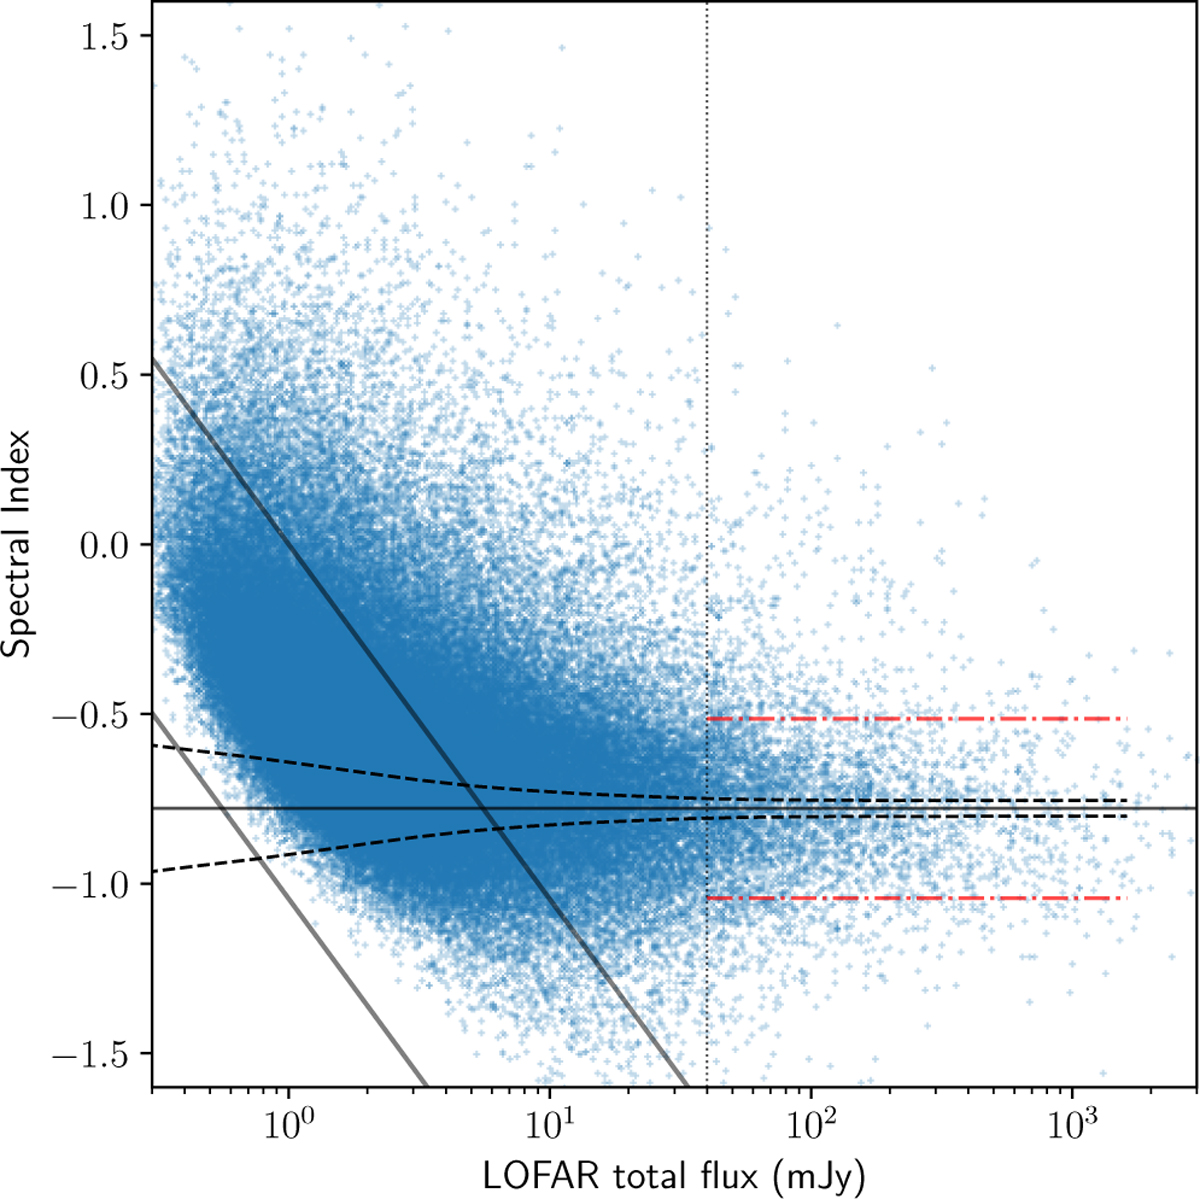
Spectral index distribution against the LOFAR integrated flux density for compact sources. The median value α = −0.78 (horizontal line) is calculated for the sources with integrated flux density above 40 mJy at 150 MHz. The surrounding dashed curves show ±σα,S error due to flux density uncertainties. The inclined solid lines show spectral index lower limit calculated for the weakest Apertif source and for 1 mJy level corresponding to the completeness of 95%. An overall scatter, ±σα, of the spectral index is shown with dash-dotted lines.
Current usage metrics show cumulative count of Article Views (full-text article views including HTML views, PDF and ePub downloads, according to the available data) and Abstracts Views on Vision4Press platform.
Data correspond to usage on the plateform after 2015. The current usage metrics is available 48-96 hours after online publication and is updated daily on week days.
Initial download of the metrics may take a while.