Open Access
Fig. 5
Download original image
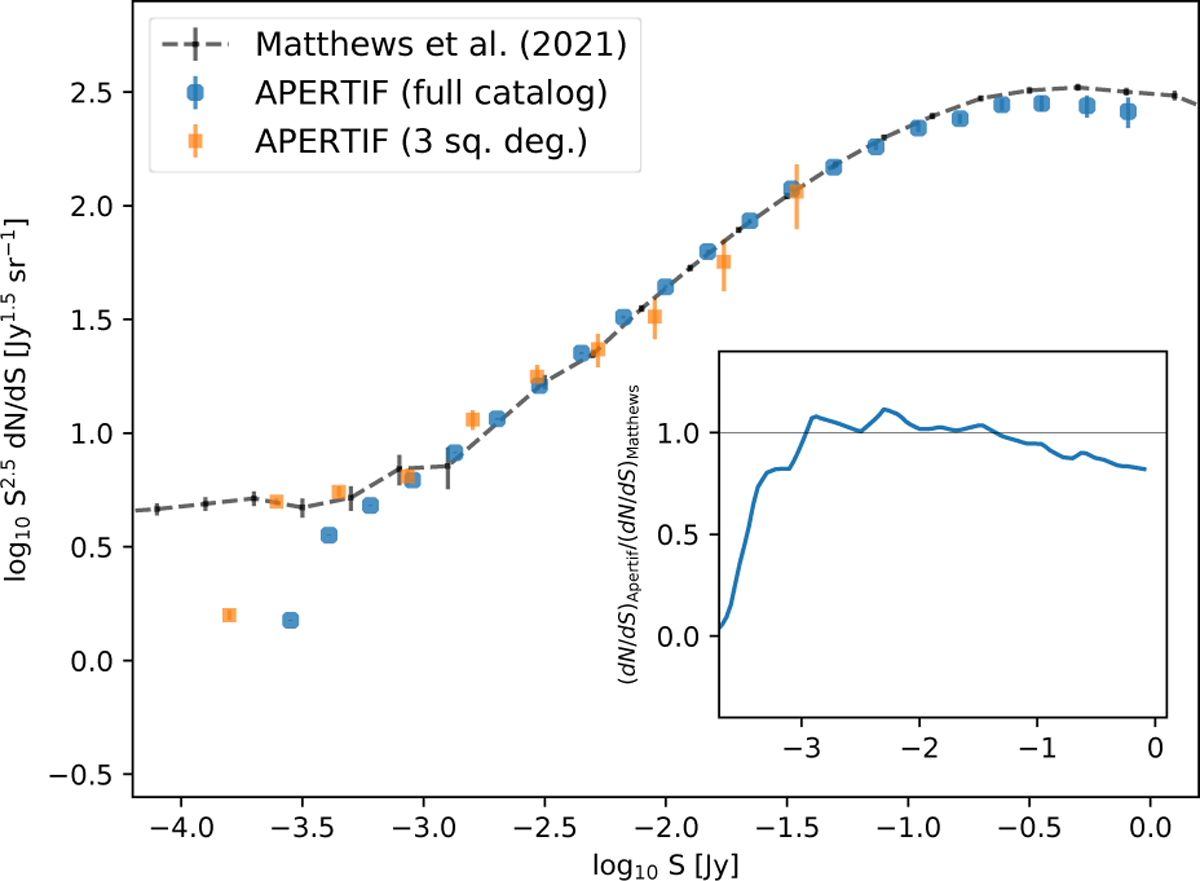
Differential source counts. The source counts estimates for the full catalog area (circles) and for the low-noise mosaic image (Fig. 3, squares) plotted along with the measurements of Matthews et al. (2021; dot-dashed curve). The ratio (dN/dS)Apertif/(dN/dS)Matthews is shown in the inset plot.
Current usage metrics show cumulative count of Article Views (full-text article views including HTML views, PDF and ePub downloads, according to the available data) and Abstracts Views on Vision4Press platform.
Data correspond to usage on the plateform after 2015. The current usage metrics is available 48-96 hours after online publication and is updated daily on week days.
Initial download of the metrics may take a while.