Fig. 3
Download original image
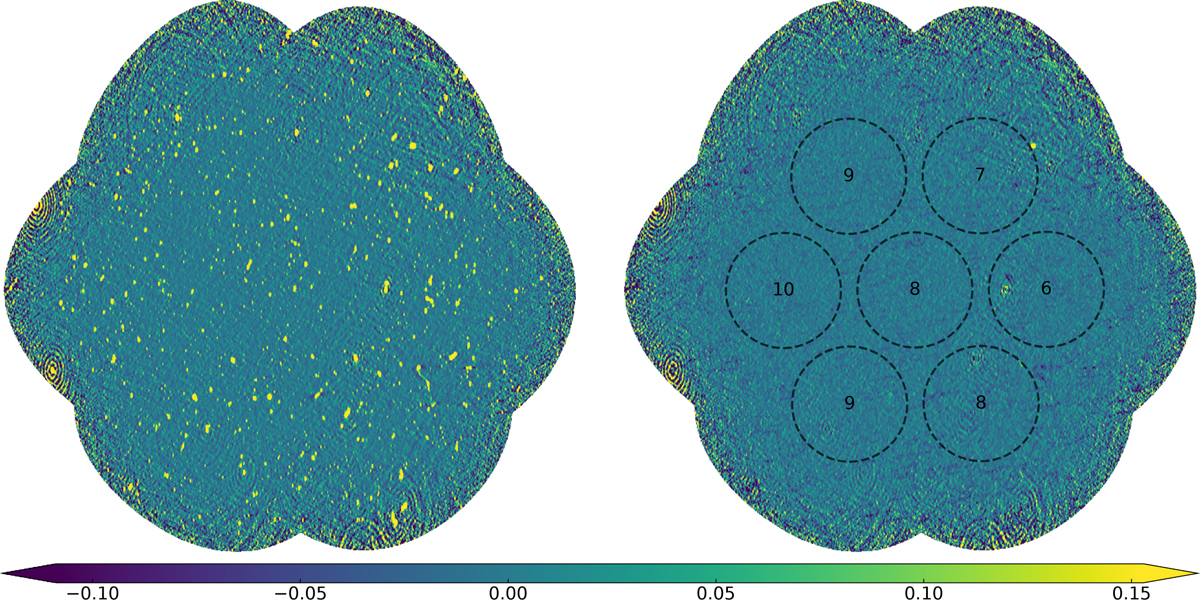
Mosaic example of 57 individual CB images with the center at RA = 29.26, Dec = 34.55 degrees (left panel) and the residual noise map (right panel). Seven dashed circles show the positions of compound beams, and the numbers inside indicate the quantity of the corresponding CB images used for mosaicking. The color bar scale is given in mJy beam−1.
Current usage metrics show cumulative count of Article Views (full-text article views including HTML views, PDF and ePub downloads, according to the available data) and Abstracts Views on Vision4Press platform.
Data correspond to usage on the plateform after 2015. The current usage metrics is available 48-96 hours after online publication and is updated daily on week days.
Initial download of the metrics may take a while.