Fig. 8
Download original image
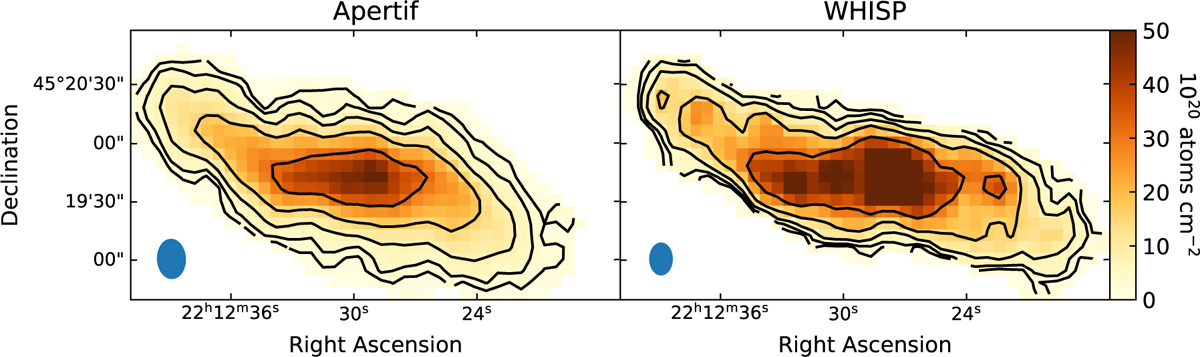
H i content of UGC 11951 as detected in both Apertif (left) and WHISP (right). The color scale is the same between the two images and the contours are at [2, 4, 8, 16, 32] × 1020 atoms cm−2. We note that the WHISP data have a smaller beam size as uniform weighting was used; this can also account for the difference in peak column density values between the two images. The Apertif data is from a single beam; mosaicking would further increase the signal in that map.
Current usage metrics show cumulative count of Article Views (full-text article views including HTML views, PDF and ePub downloads, according to the available data) and Abstracts Views on Vision4Press platform.
Data correspond to usage on the plateform after 2015. The current usage metrics is available 48-96 hours after online publication and is updated daily on week days.
Initial download of the metrics may take a while.