Fig. 7
Download original image
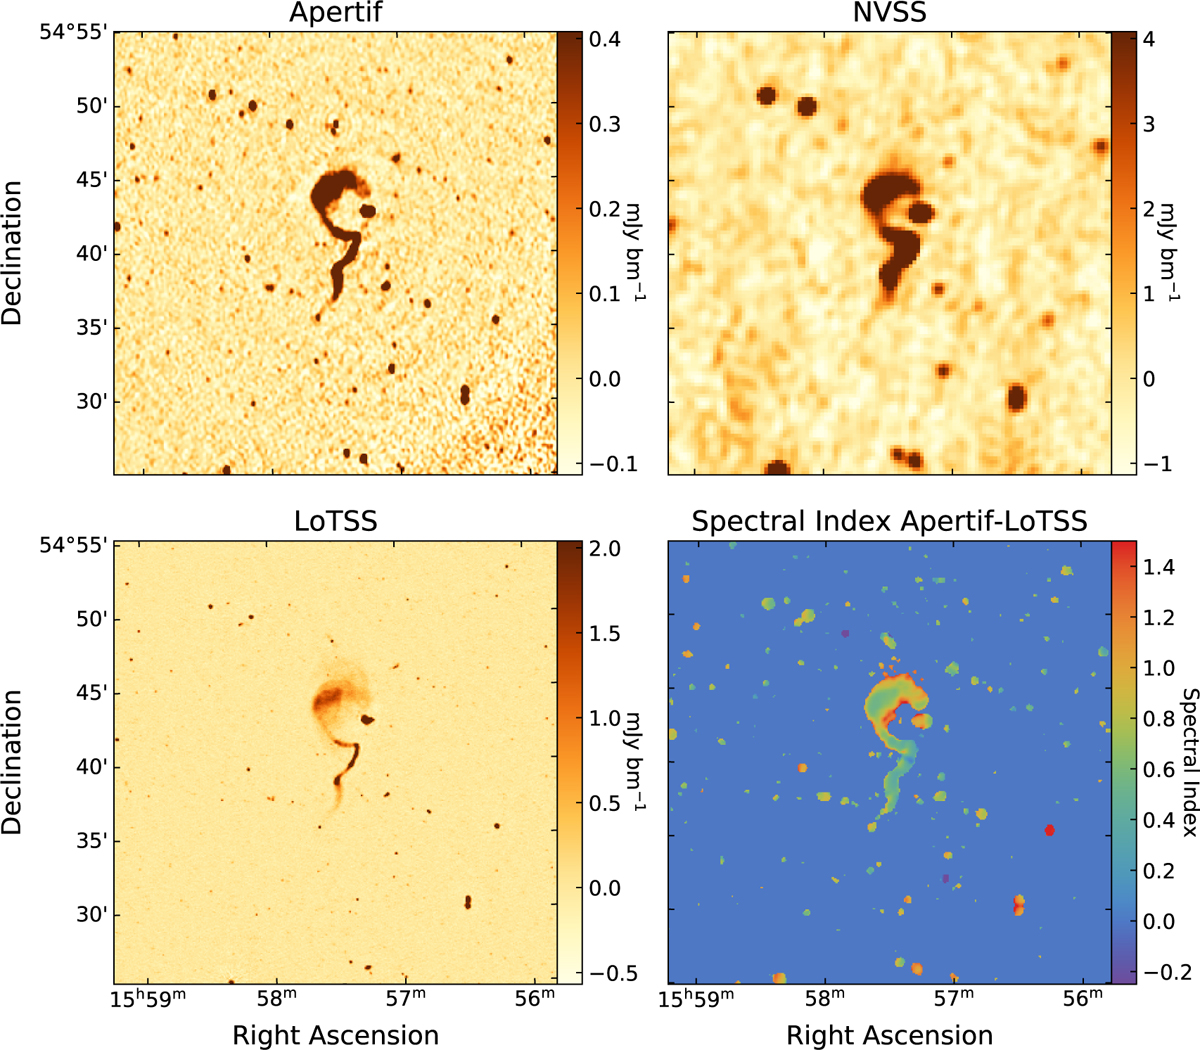
Example Apertif continuum image with comparison to NVSS and LoTSS. Upper left: Apertif continuum image, mosaicked as described in K22. Upper right: NVSS image of the same field (Condon et al. 1998). Lower left: LoTSS image of the same field (Shimwell et al. 2022), with the scaling set so that a point source with a spectral index of 0.7 has the same brightness as in the Apertif image. Lower right: spectral index image between the Apertif and LoTSS image.
Current usage metrics show cumulative count of Article Views (full-text article views including HTML views, PDF and ePub downloads, according to the available data) and Abstracts Views on Vision4Press platform.
Data correspond to usage on the plateform after 2015. The current usage metrics is available 48-96 hours after online publication and is updated daily on week days.
Initial download of the metrics may take a while.