Fig. 2
Download original image
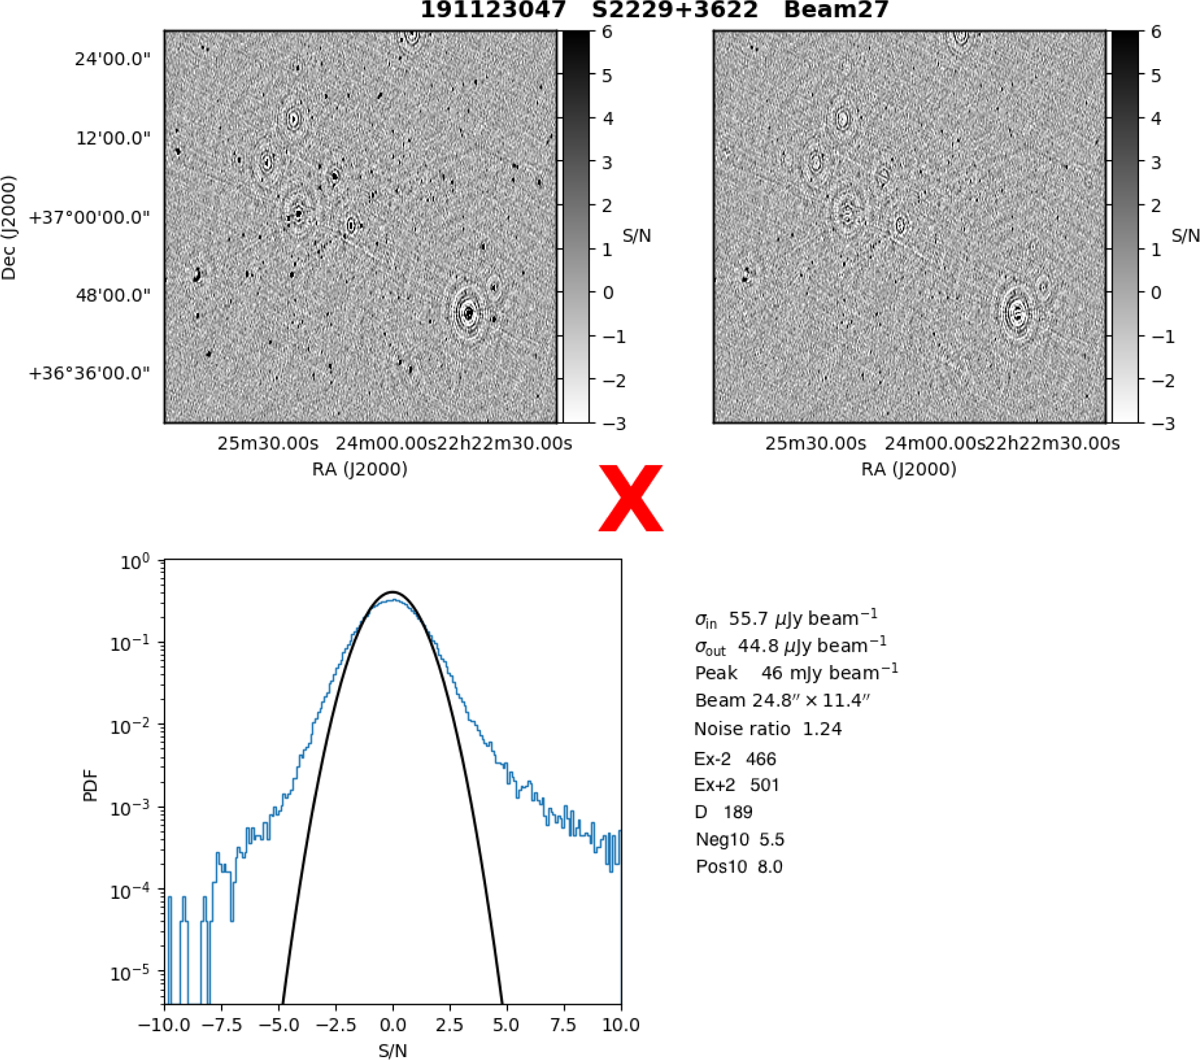
Example of a continuum image that fails validation (as indicated by the red x); beam 27 of ObsID 191123047. The four panels shown are: upper left: continuum image; upper right: residual image (note the uncleaned source emission); lower left: flux density histogram of all pixels in the residual image (blue) compared to a Gaussian distribution (black) corresponding to σout; lower right: statistics calculated for the beam. These include the metrics in Sect. 4.1, in addition to other stasitics not (curtently) used in the validation. The first five are: σin, σout, the peak in the continuum image, the restoring beam, and R. The next two are Ex−2 and Ex+2. The dynamic range (D) is calculated as the peak of the continuum image divided by Neg10 × σout. The final two statiatics are Neg10 and Pos10.
Current usage metrics show cumulative count of Article Views (full-text article views including HTML views, PDF and ePub downloads, according to the available data) and Abstracts Views on Vision4Press platform.
Data correspond to usage on the plateform after 2015. The current usage metrics is available 48-96 hours after online publication and is updated daily on week days.
Initial download of the metrics may take a while.