Fig. 1
Download original image
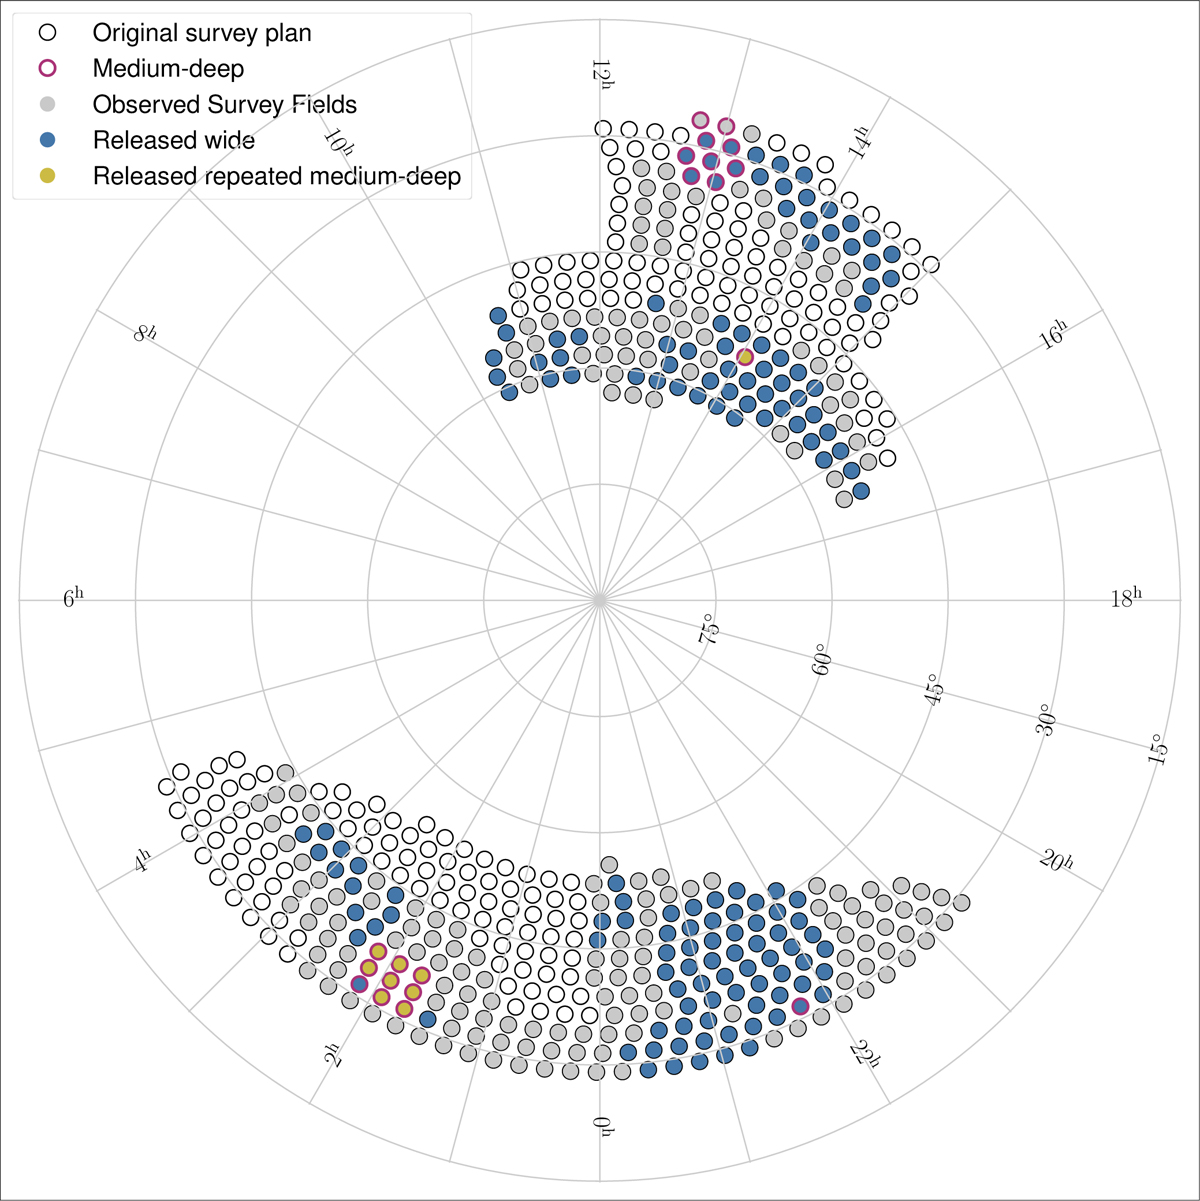
Sky view of Apertif imaging observations. Blue circles indicate wide observations (single visit) while pink circles indicate fields with multiple visits as part of this data release (but we note that data products are only released for individual observations). The open black circles indicate the coverage in the original 4-yr survey plan. Grey circles show Apertif observations to date; these effectively represent the final survey footprint. Circles outlined in purple nave medium-deep coverage in the full survey.
Current usage metrics show cumulative count of Article Views (full-text article views including HTML views, PDF and ePub downloads, according to the available data) and Abstracts Views on Vision4Press platform.
Data correspond to usage on the plateform after 2015. The current usage metrics is available 48-96 hours after online publication and is updated daily on week days.
Initial download of the metrics may take a while.