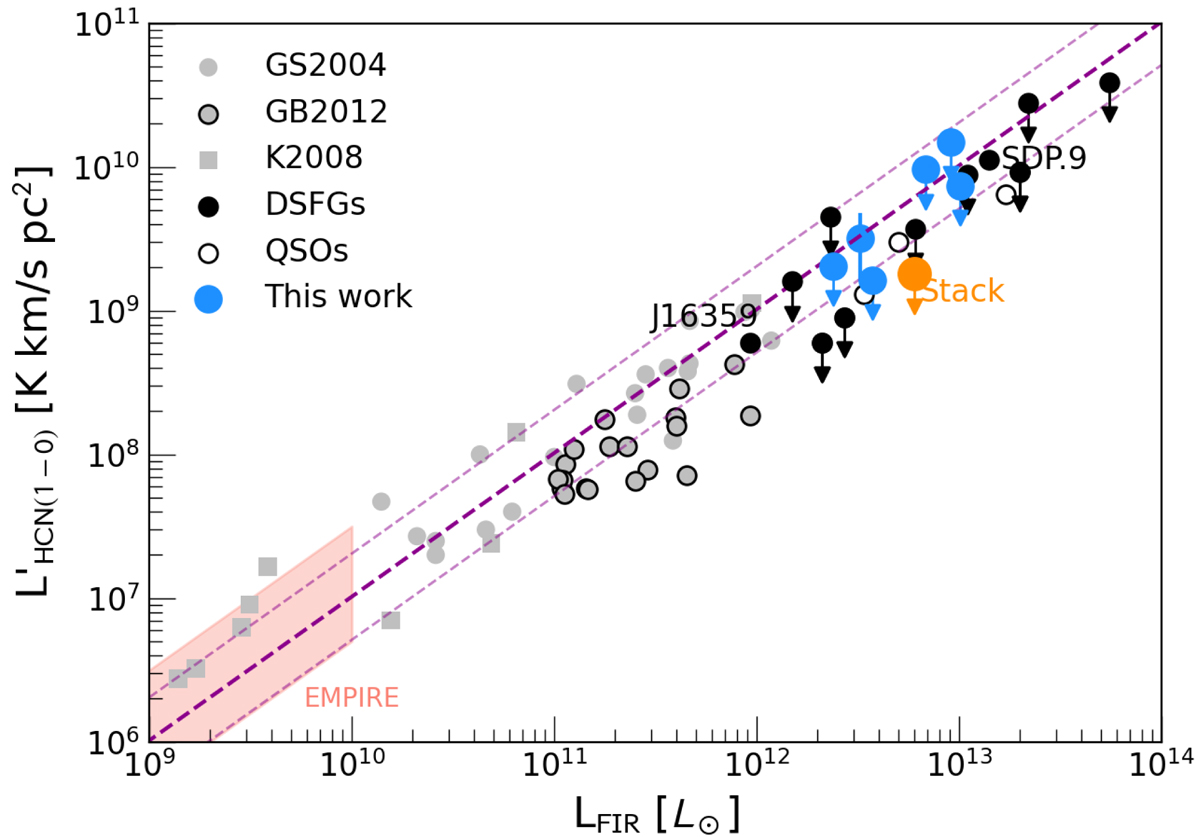
Fig. 5.
Download original image
Comparison of HCN(1–0) and FIR luminosity in our sample (blue) with low-redshift galaxies (Gao & Solomon 2004b; Krips et al. 2008; García-Burillo et al. 2012) and high-redshift DSFGs and QSOs. For the lensed sources, we show the source-plane (de-lensed) values. The upper limit from the stacked spectrum (Fig. 4) is shown in orange. The purple line indicates the mean HCN/FIR ratio from Jiménez-Donaire et al. (2019) ±1σ scatter (Eq. (1)). The bulk of our sample falls below the linear HCN-FIR trend, in agreement with the expectations of a sub-linear correlation in highly star-forming galaxies (Krumholz & Thompson 2007; Narayanan et al. 2008).
Current usage metrics show cumulative count of Article Views (full-text article views including HTML views, PDF and ePub downloads, according to the available data) and Abstracts Views on Vision4Press platform.
Data correspond to usage on the plateform after 2015. The current usage metrics is available 48-96 hours after online publication and is updated daily on week days.
Initial download of the metrics may take a while.