Fig. 10.
Download original image
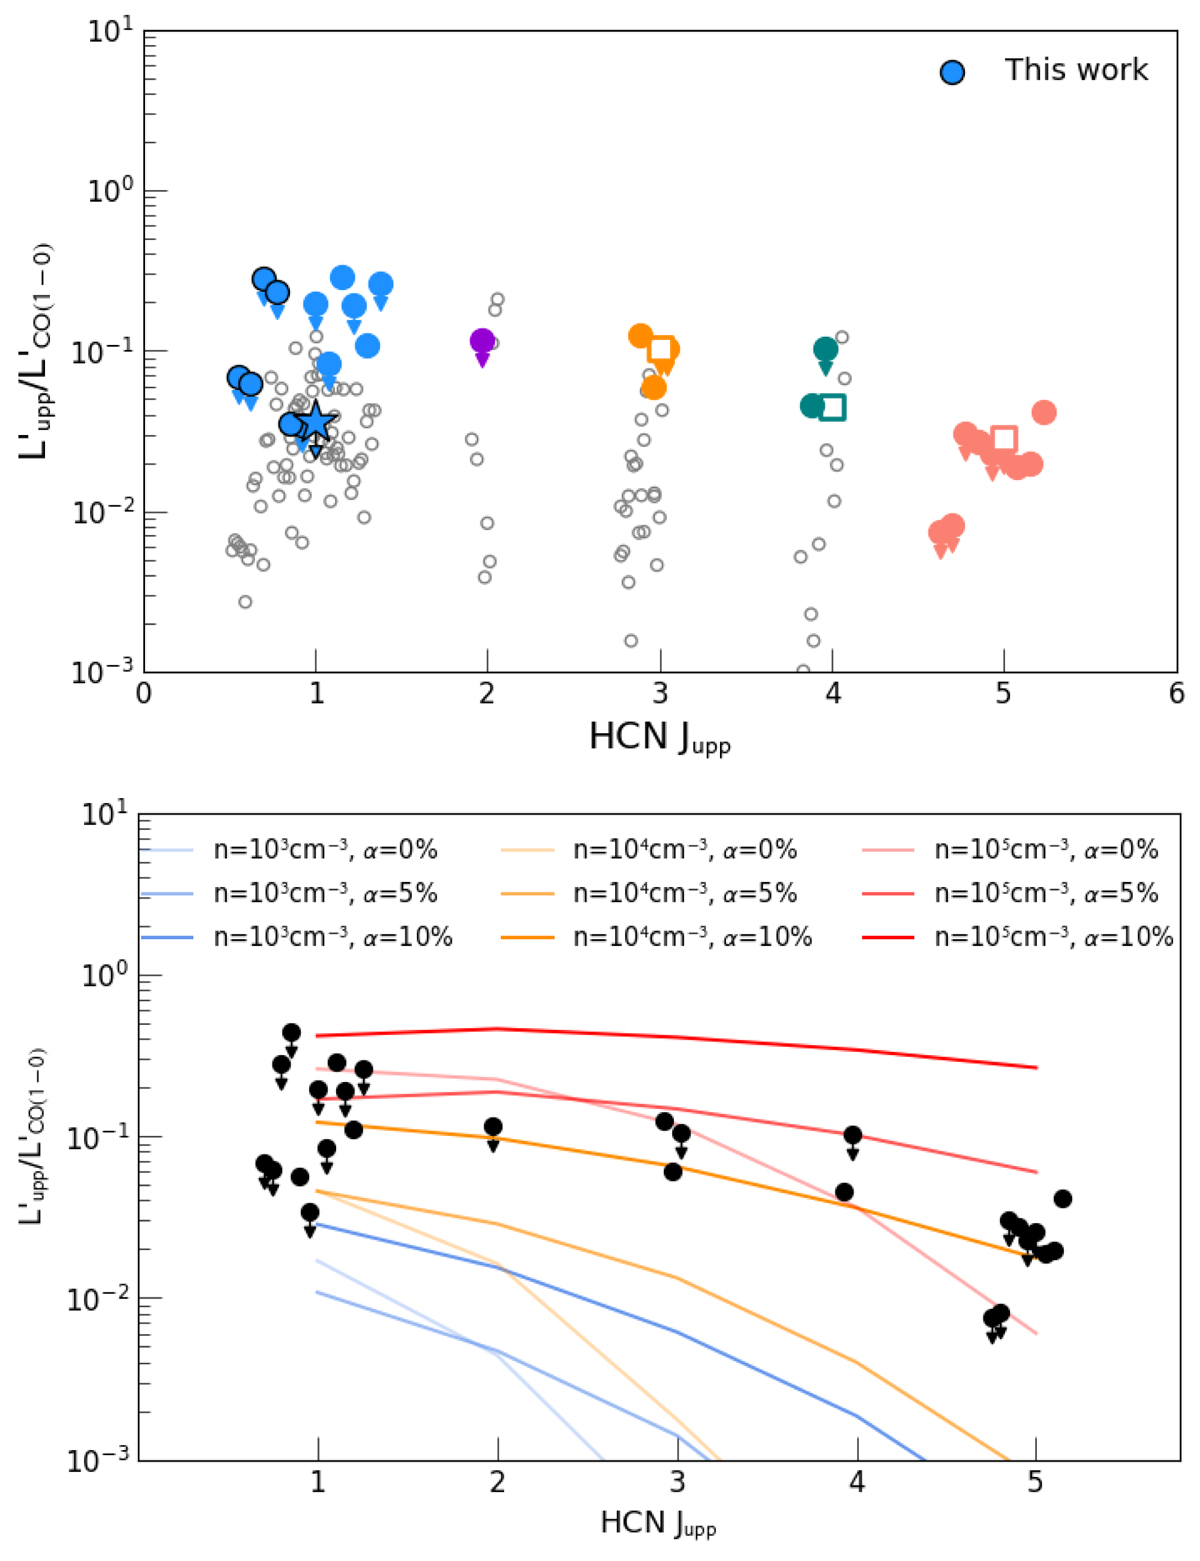
Comparison of ![]() ratios in DSFGs for HCN(1–0) to (5–4) observations from the literature (upper). The coloured points indicate high-z measurements; grey ones z = 0 observations. Our HCN(1–0) measurements are outlined in black; the star indicates the limit from the stacked K-band spectrum. Lower: high-z HCN measurements, compared to the predictions of PDR models from Kazandjian et al. (2015). We vary the PDR gas density (n = 103 − 105 cm−3) and the mechanical heating factor (α = 0–10%). The FUV irradiation is fixed to G = 104 G0. The current high-z HCN detections can not be reproduced by models with n ≤ 104 cm−3 without significant mechanical heating. High-z data: HCN(1–0): Carilli et al. (2005), Gao et al. (2007), Oteo et al. (2017); HCN(2–1): G. Jolink (BSc thesis); HCN(3–2): Danielson et al. (2013), Oteo et al. (2017); HCN(4–3) and (5–4): Béthermin et al. (2018), Cañameras et al. (2021). Low-z data: HCN(1–0): Gao & Solomon (2004b), García-Burillo et al. (2012); HCN(2–1): Krips et al. (2008), HCN(3–2): Bussmann et al. (2008), Li et al. (2020), HCN(4–3): Zhang et al. (2014). The squares correspond to the Spilker et al. (2014) stacking analysis.
ratios in DSFGs for HCN(1–0) to (5–4) observations from the literature (upper). The coloured points indicate high-z measurements; grey ones z = 0 observations. Our HCN(1–0) measurements are outlined in black; the star indicates the limit from the stacked K-band spectrum. Lower: high-z HCN measurements, compared to the predictions of PDR models from Kazandjian et al. (2015). We vary the PDR gas density (n = 103 − 105 cm−3) and the mechanical heating factor (α = 0–10%). The FUV irradiation is fixed to G = 104 G0. The current high-z HCN detections can not be reproduced by models with n ≤ 104 cm−3 without significant mechanical heating. High-z data: HCN(1–0): Carilli et al. (2005), Gao et al. (2007), Oteo et al. (2017); HCN(2–1): G. Jolink (BSc thesis); HCN(3–2): Danielson et al. (2013), Oteo et al. (2017); HCN(4–3) and (5–4): Béthermin et al. (2018), Cañameras et al. (2021). Low-z data: HCN(1–0): Gao & Solomon (2004b), García-Burillo et al. (2012); HCN(2–1): Krips et al. (2008), HCN(3–2): Bussmann et al. (2008), Li et al. (2020), HCN(4–3): Zhang et al. (2014). The squares correspond to the Spilker et al. (2014) stacking analysis.
Current usage metrics show cumulative count of Article Views (full-text article views including HTML views, PDF and ePub downloads, according to the available data) and Abstracts Views on Vision4Press platform.
Data correspond to usage on the plateform after 2015. The current usage metrics is available 48-96 hours after online publication and is updated daily on week days.
Initial download of the metrics may take a while.