Open Access
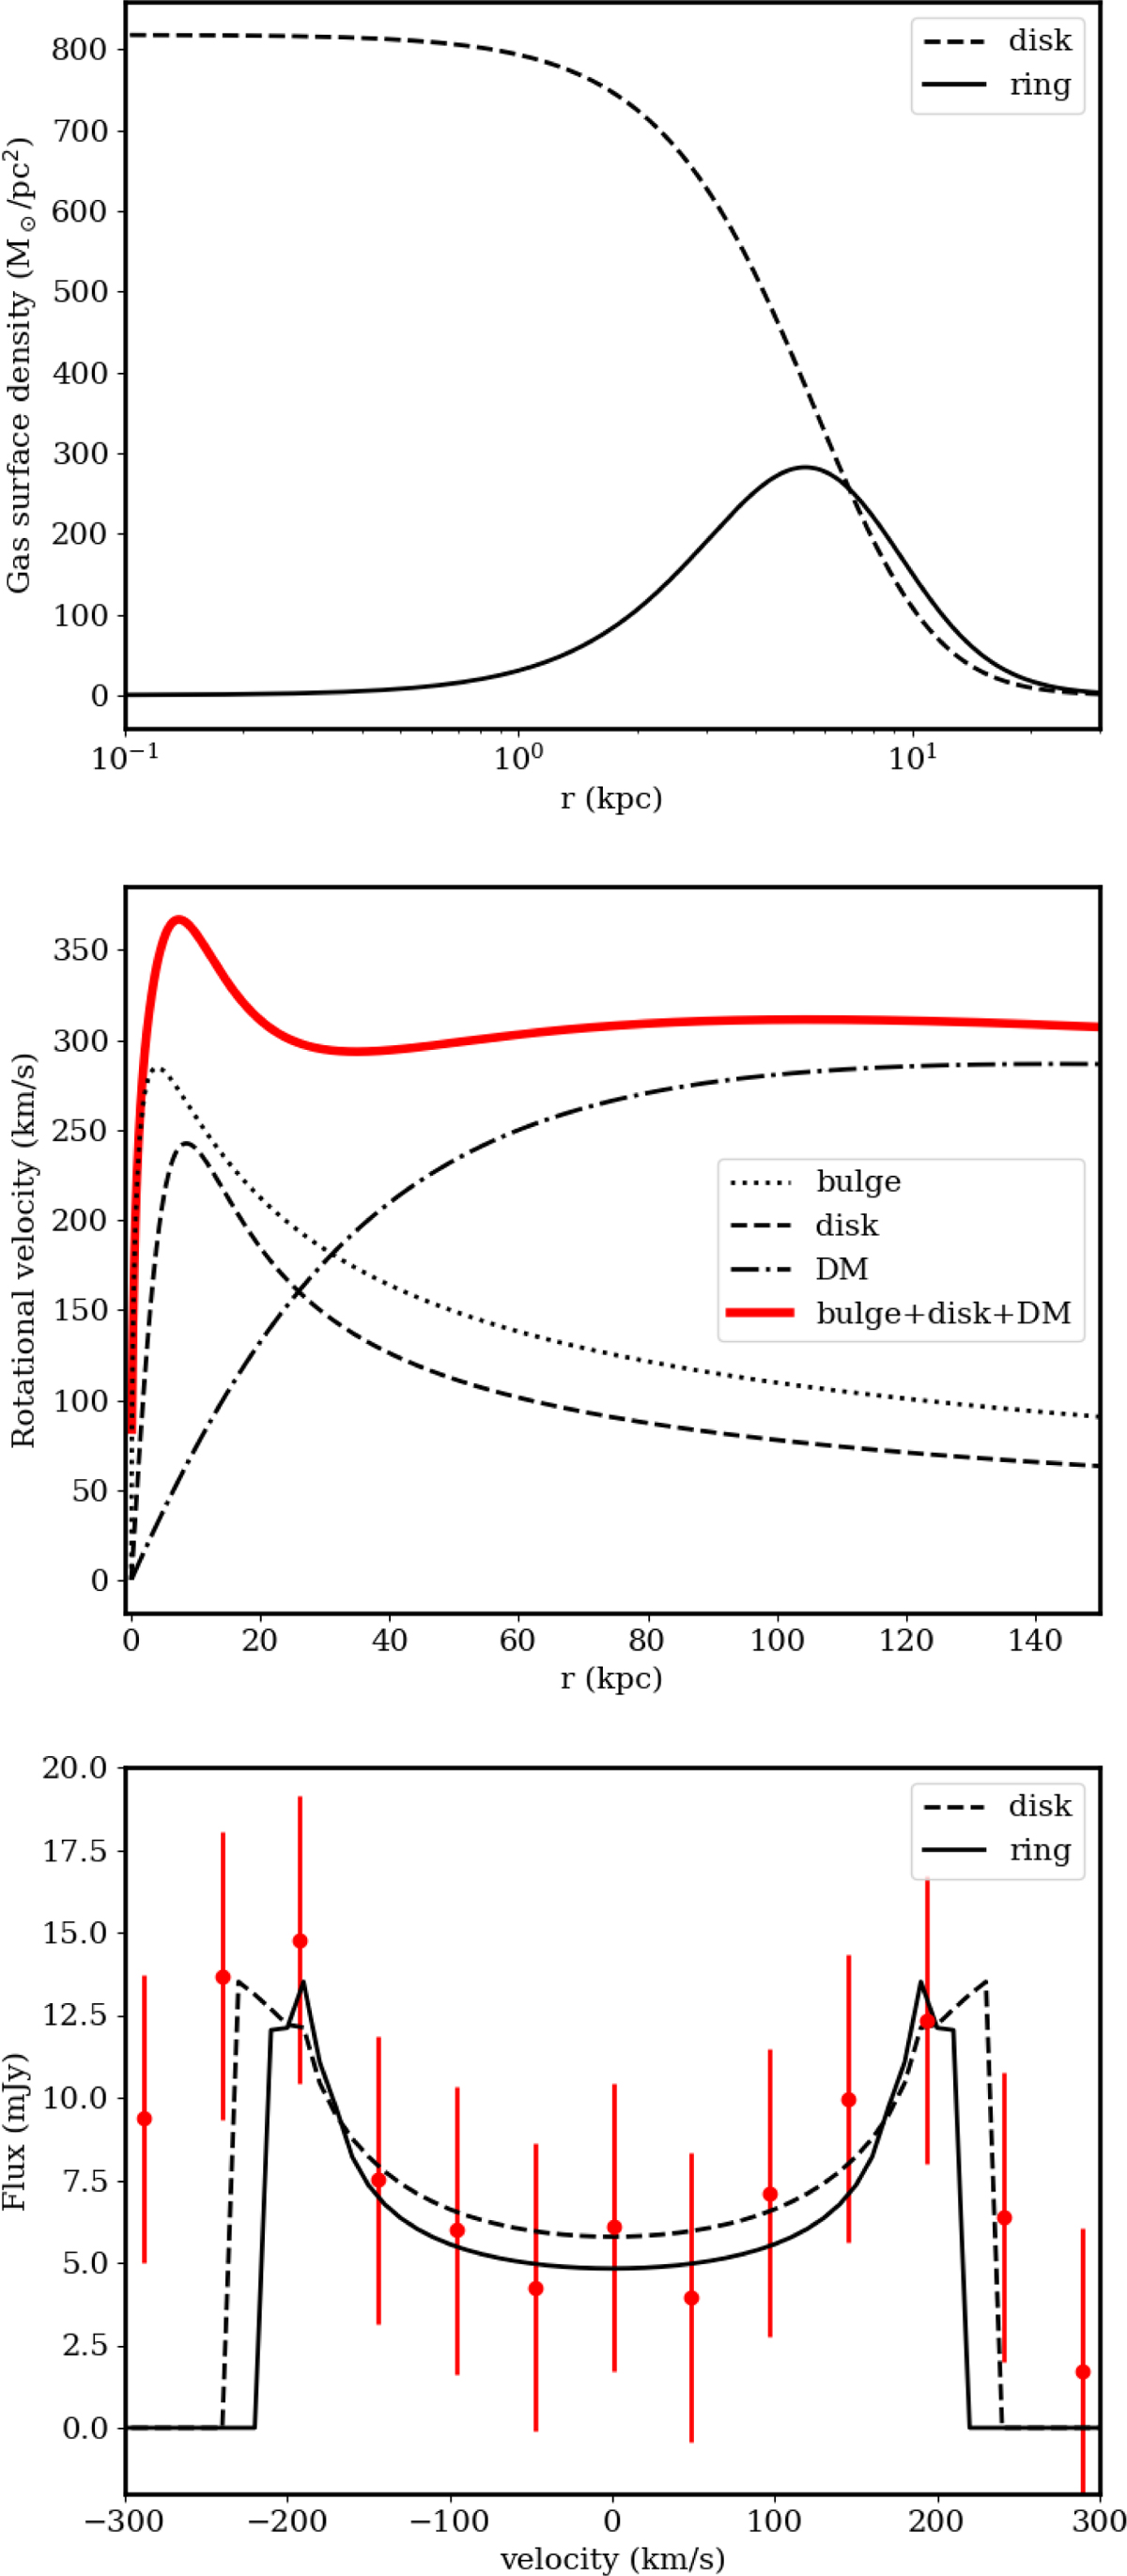
Fig. 8.
Download original image
Modeling of the double-horn CO(3→2) emission line for KiDS 1220. Top: H2 gas density profile. Center: rotational velocity curve. Bottom: observed spectrum and modeling. See the legend and text for further details.
Current usage metrics show cumulative count of Article Views (full-text article views including HTML views, PDF and ePub downloads, according to the available data) and Abstracts Views on Vision4Press platform.
Data correspond to usage on the plateform after 2015. The current usage metrics is available 48-96 hours after online publication and is updated daily on week days.
Initial download of the metrics may take a while.