Fig. 5.
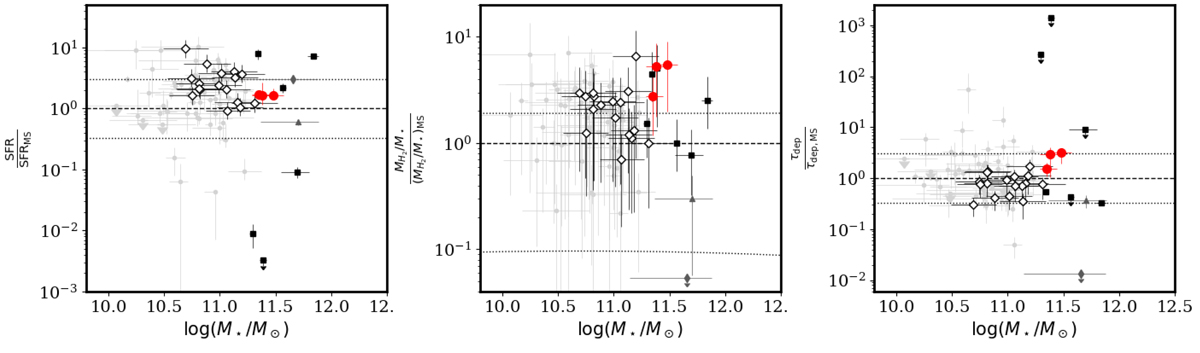
Download original image
SFR (left), molecular gas-to-stellar mass ratio (center), and depletion time (right), as a function of the stellar mass for distant BCGs and cluster galaxies observed in CO. The y-axis values are all normalized to the corresponding MS values using the relations by Speagle et al. (2014) and Tacconi et al. (2018). The horizontal dashed lines correspond to y-axis values equal to unity, while the dotted lines denote the fiducial uncertainties associated with the MS. The uncertainty is chosen to be equal to ±0.48 dex for both the left and right panels since the MS is commonly identified by 1/3 < SFR/SFRMS < 3. For the central panel, the plotted uncertainties are estimated at redshift z = 0.5. The color-coding for the data points is the same as in Fig. 4.
Current usage metrics show cumulative count of Article Views (full-text article views including HTML views, PDF and ePub downloads, according to the available data) and Abstracts Views on Vision4Press platform.
Data correspond to usage on the plateform after 2015. The current usage metrics is available 48-96 hours after online publication and is updated daily on week days.
Initial download of the metrics may take a while.