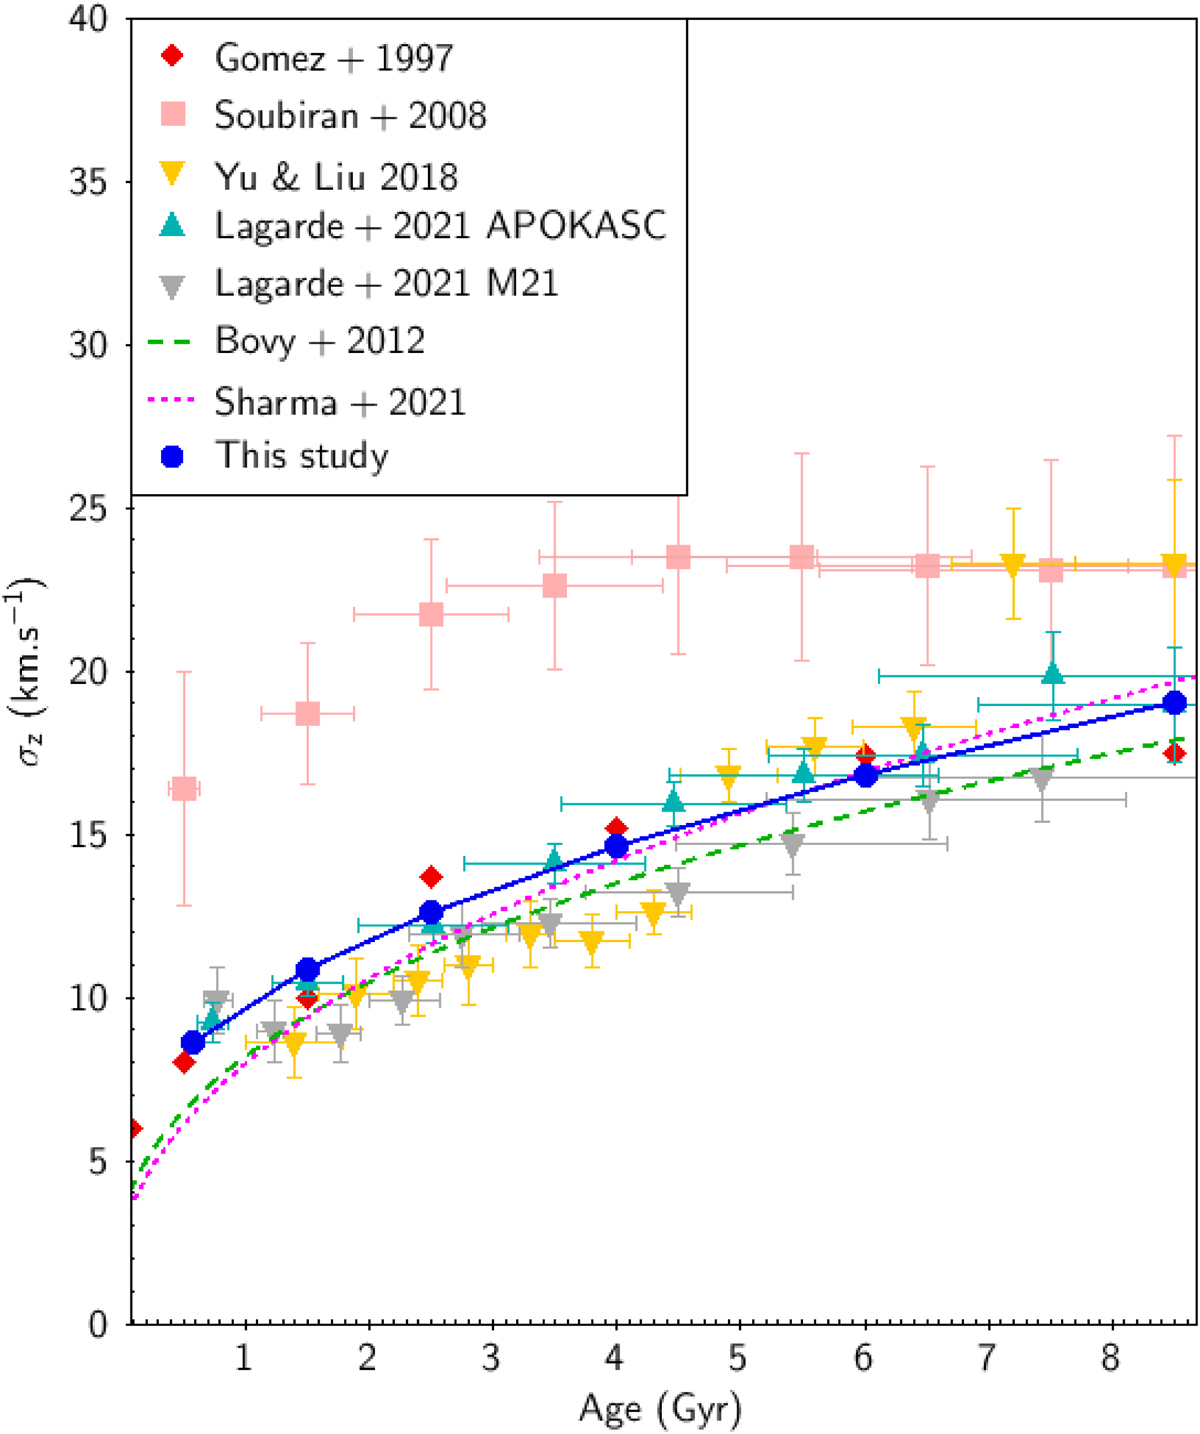
Fig. 7.
Download original image
Age–vertical velocity dispersion relation at the Solar position. Red diamonds: Gómez et al. (1997) from Hipparcos. Yellow triangles: Yu & Liu (2018) from LAMOST red giants with [Fe/H] > −0.2. Pink squares: Soubiran et al. (2008) from red clump giants. Cyan triangles: Thin disc population from Lagarde et al. (2021) with ages from Miglio et al. (2021)(M21). Dark grey triangles: Thin disc population from Lagarde et al. (2021) with ages from APOKASC (Pinsonneault et al. 2018). Green dashed line: Relation from the model of Bovy et al. (2012). Magenta dotted line: Relation from Sharma et al. (2021). Blue filled circles: This study.
Current usage metrics show cumulative count of Article Views (full-text article views including HTML views, PDF and ePub downloads, according to the available data) and Abstracts Views on Vision4Press platform.
Data correspond to usage on the plateform after 2015. The current usage metrics is available 48-96 hours after online publication and is updated daily on week days.
Initial download of the metrics may take a while.