Fig. 4.
Download original image
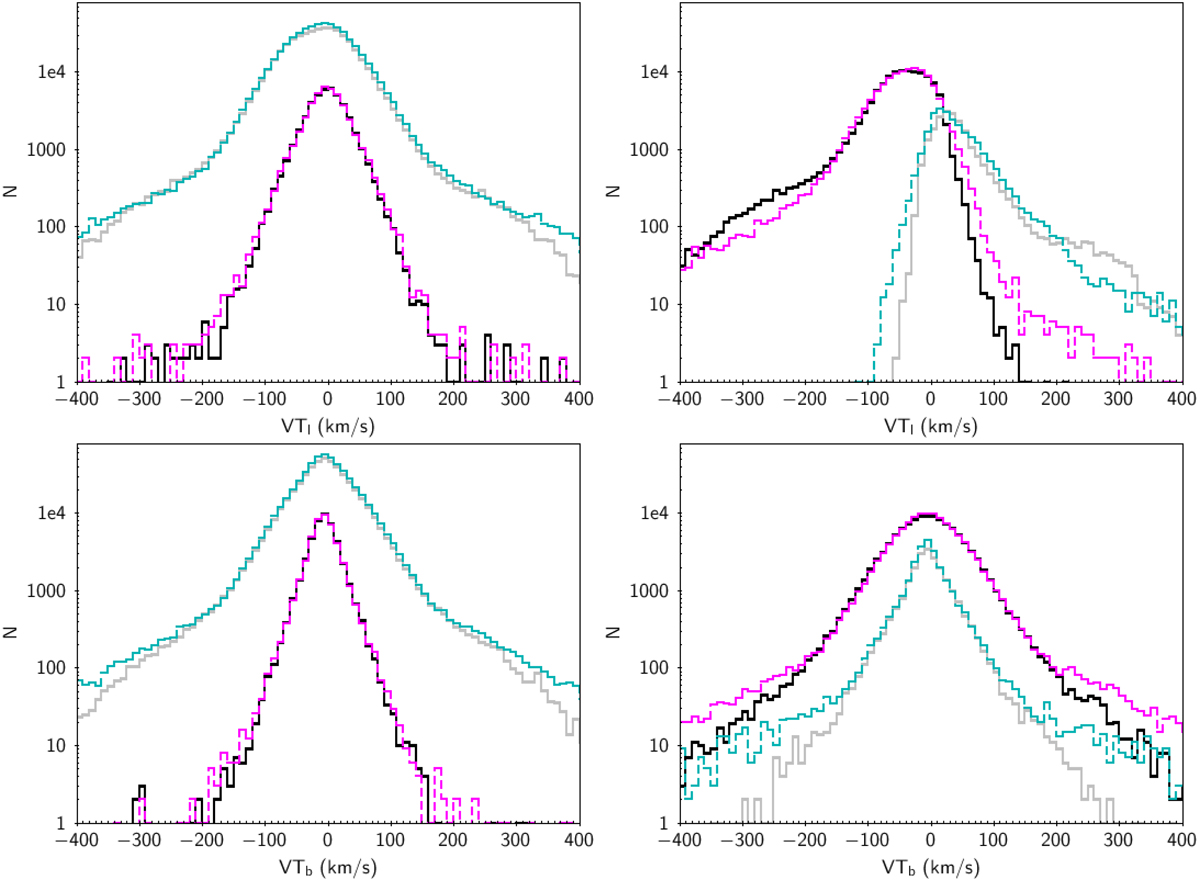
Histograms of the transverse velocities for the local sample and for deep fields, with pseudo-R smaller than 8 kpc or larger than 9 kpc: Vtl (top row), Vtb (bottom row). Left column: local data (continuous black line), local model (magenta dashed line), deep field data (continuous grey line), and deep field model (dashed cyan line). Right column: R < 8 kpc data (continuous black line), R < 8 kpc model (magenta dashed line), R > 9 kpc data (continuous grey line), and R > 9 kpc model (dashed cyan line).
Current usage metrics show cumulative count of Article Views (full-text article views including HTML views, PDF and ePub downloads, according to the available data) and Abstracts Views on Vision4Press platform.
Data correspond to usage on the plateform after 2015. The current usage metrics is available 48-96 hours after online publication and is updated daily on week days.
Initial download of the metrics may take a while.