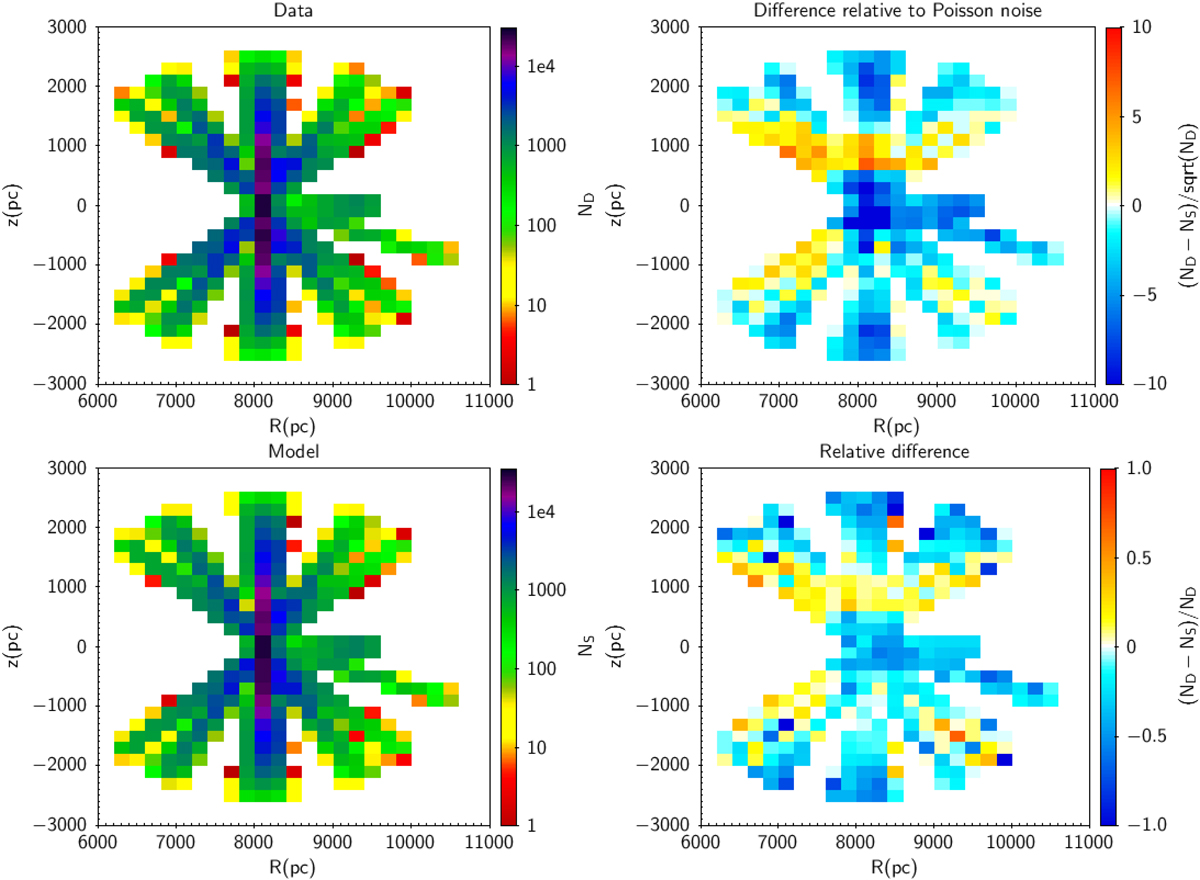
Fig. 3.
Download original image
Number density as a function of pseudo R and z (see text) in the selected data set. Gaia data ND (top left) and our final model NS (bottom left). Difference between data and model relative to the Poisson noise (ND–NS)/sqrt(ND) (top right). Relative difference between counts (ND − NS)/ND (bottom right). The relative difference shows that the model accuracy is generally better than 10%, apart from the regions showing the vertical wave (see text).
Current usage metrics show cumulative count of Article Views (full-text article views including HTML views, PDF and ePub downloads, according to the available data) and Abstracts Views on Vision4Press platform.
Data correspond to usage on the plateform after 2015. The current usage metrics is available 48-96 hours after online publication and is updated daily on week days.
Initial download of the metrics may take a while.