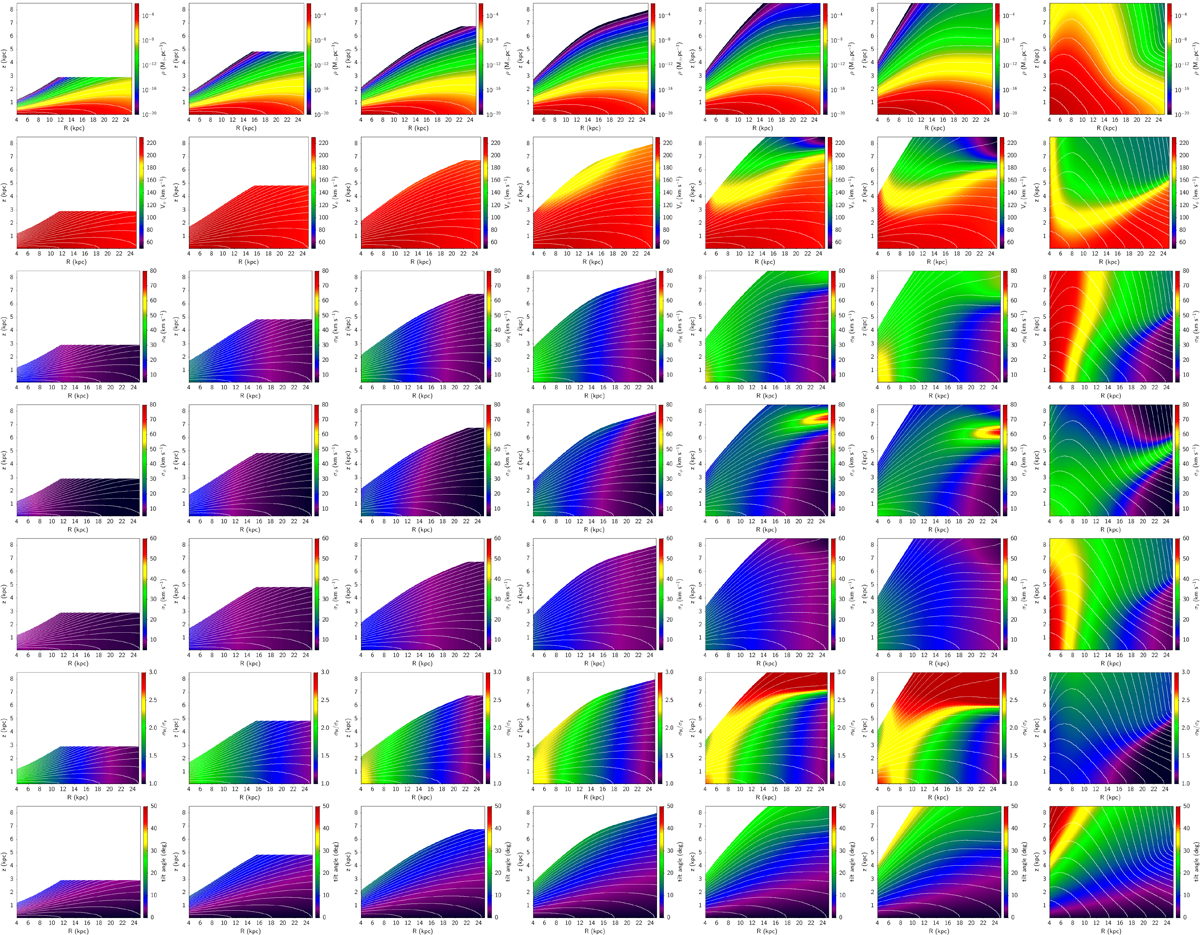
Fig. B.1.
Download original image
Density and kinematics as a function of R and z for different disc components. Columns 1 to 6 represent thin disc components 2 to 7. Columns 7 is for the young thick disc. The densities are shown for values larger than 10−20 M⊙ pc−3. Regions in white have either not been computed or the density is below this limit. Different rows are for different quantities from top to bottom: density (in M⊙ pc−3), Vϕ, σR, σϕ, σz, σR/σz (in km s−1), tilt angle of the ellipsoid (in degree). Isocontours are spaced by decimal logarithm of the density for densities larger than 10−20 M⊙ pc−3.
Current usage metrics show cumulative count of Article Views (full-text article views including HTML views, PDF and ePub downloads, according to the available data) and Abstracts Views on Vision4Press platform.
Data correspond to usage on the plateform after 2015. The current usage metrics is available 48-96 hours after online publication and is updated daily on week days.
Initial download of the metrics may take a while.