Fig. 1.
Download original image
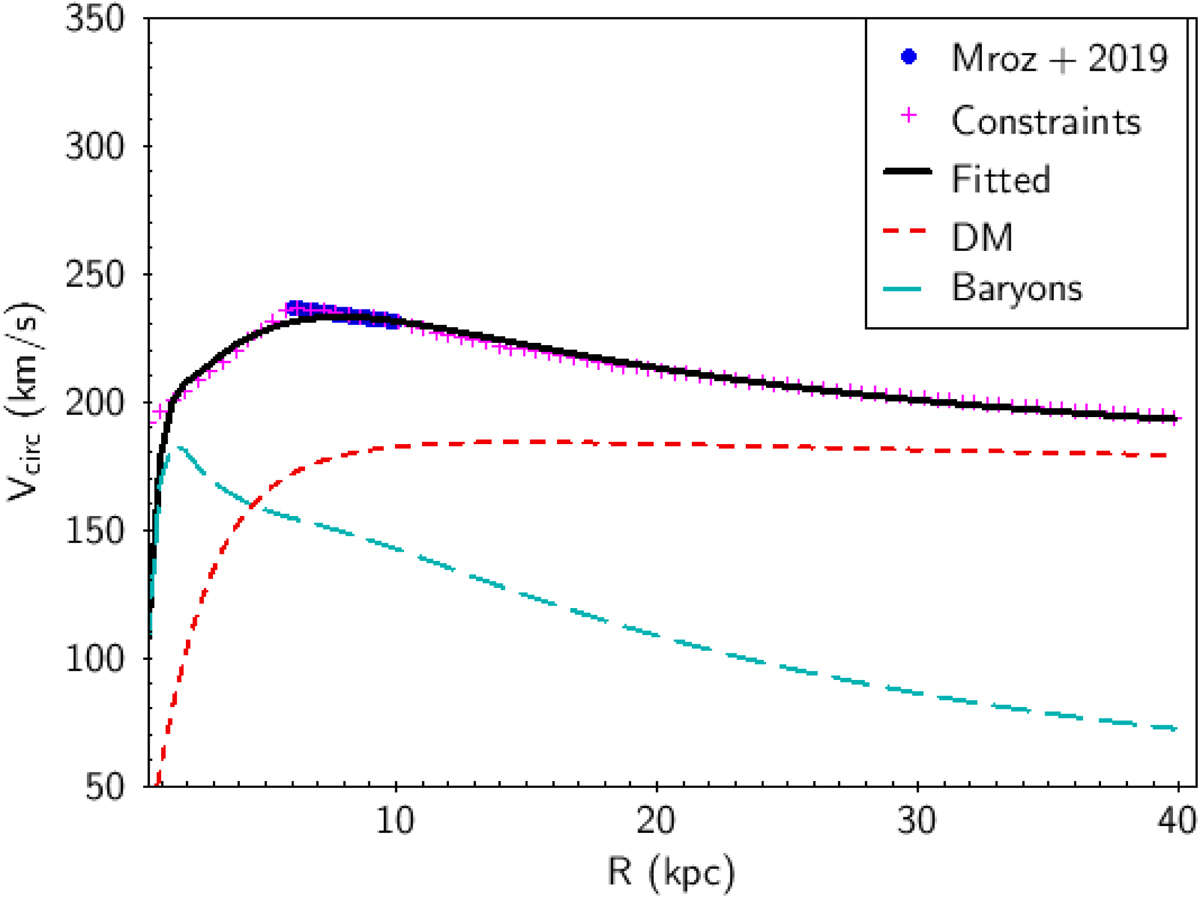
Adopted Galactic rotation curve. Blue dots are cepheid observations from Mróz et al. (2019). Magenta crosses represent the composite curve used as a constraint to the fit (see text). The full black line represents the circular velocity of our best-fit model. The dark matter contribution is shown as a short-dashed red line, and the baryon contribution, including the central mass, as a long-dash cyan line.
Current usage metrics show cumulative count of Article Views (full-text article views including HTML views, PDF and ePub downloads, according to the available data) and Abstracts Views on Vision4Press platform.
Data correspond to usage on the plateform after 2015. The current usage metrics is available 48-96 hours after online publication and is updated daily on week days.
Initial download of the metrics may take a while.