Fig. 7.
Download original image
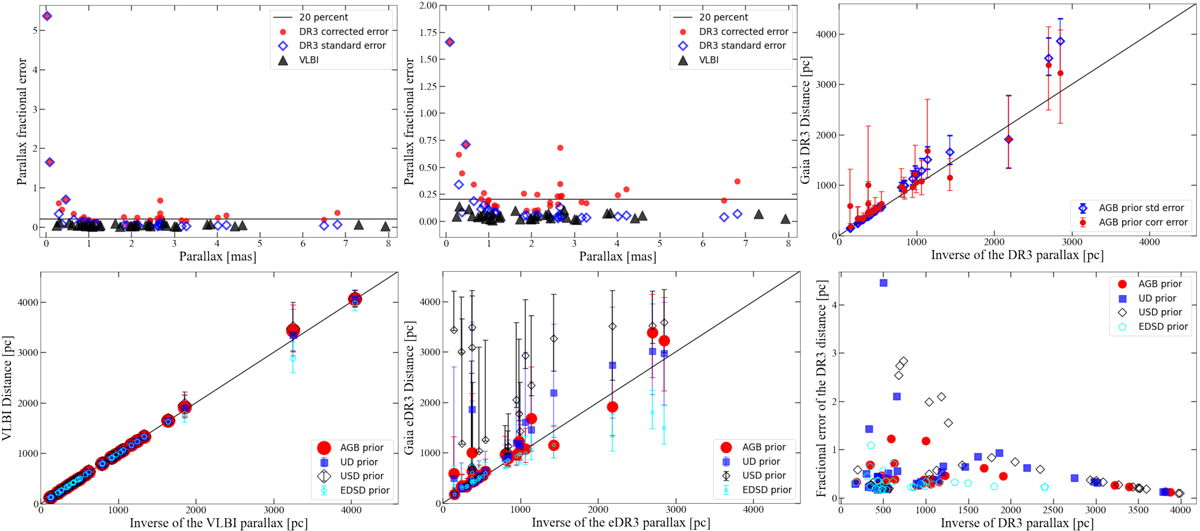
Gaia DR3 and VLBI parallaxes with the corresponding distances for the VLBI sample. Top panels: fractional errors of the VLBI (black full triangles) and Gaia DR3 parallaxes using the standard nominal error (blue open diamond) and with the corrected errors (red full circles) for the VLBI sources. The plot in the middle is a zoomed version of the plot on its left. The plot on the right compares the distances derived with Gaia DR3 parallaxes with the corrected (red) and the standard errors (blue). Bottom panels: distances derived using the four priors for the VLBI sources using the VLBI parallaxes (left) and the corrected Gaia DR3 parallaxes (middle). The solid lines represent the 1-to-1 relation. The plot at the bottom-right shows the fractional error on the derived distances.
Current usage metrics show cumulative count of Article Views (full-text article views including HTML views, PDF and ePub downloads, according to the available data) and Abstracts Views on Vision4Press platform.
Data correspond to usage on the plateform after 2015. The current usage metrics is available 48-96 hours after online publication and is updated daily on week days.
Initial download of the metrics may take a while.