Fig. 5.
Download original image
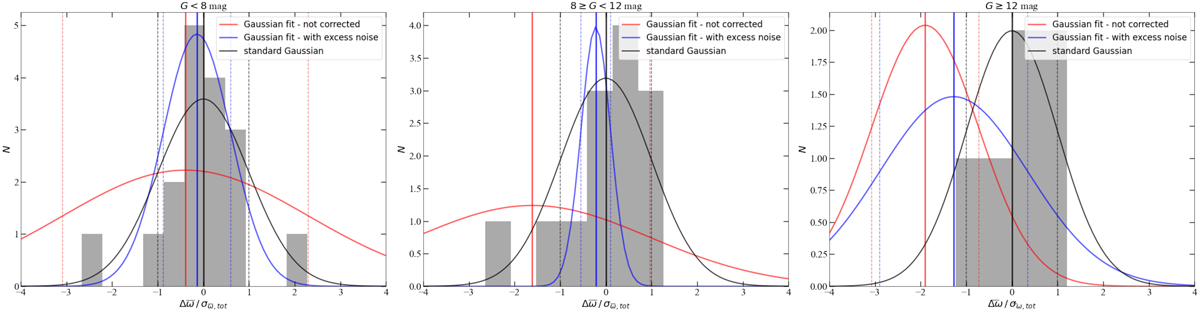
Gaussian fittings of the parallax difference distribution Δω/σϖ, tot for the three G magnitude categories. The distributions were normalised by the quadratically summed errors of the VLBI error with either: the DR3 parallax standard error without any correction (![]() , red line), or with the astrometric excess noise (
, red line), or with the astrometric excess noise (![]() , blue line), or with the DR3 parallax standard error inflated by the EIF listed in Table 2 and the parallax corrected for the ZPO (
, blue line), or with the DR3 parallax standard error inflated by the EIF listed in Table 2 and the parallax corrected for the ZPO (![]() , black line representing a standard Gaussian). The dashed lines correspond to the respective standard deviations of the Gaussians, while the solid straight lines show the mean values. The offset of the mean value with respect to 0 is a measure of the ZPO.
, black line representing a standard Gaussian). The dashed lines correspond to the respective standard deviations of the Gaussians, while the solid straight lines show the mean values. The offset of the mean value with respect to 0 is a measure of the ZPO.
Current usage metrics show cumulative count of Article Views (full-text article views including HTML views, PDF and ePub downloads, according to the available data) and Abstracts Views on Vision4Press platform.
Data correspond to usage on the plateform after 2015. The current usage metrics is available 48-96 hours after online publication and is updated daily on week days.
Initial download of the metrics may take a while.