Fig. 12.
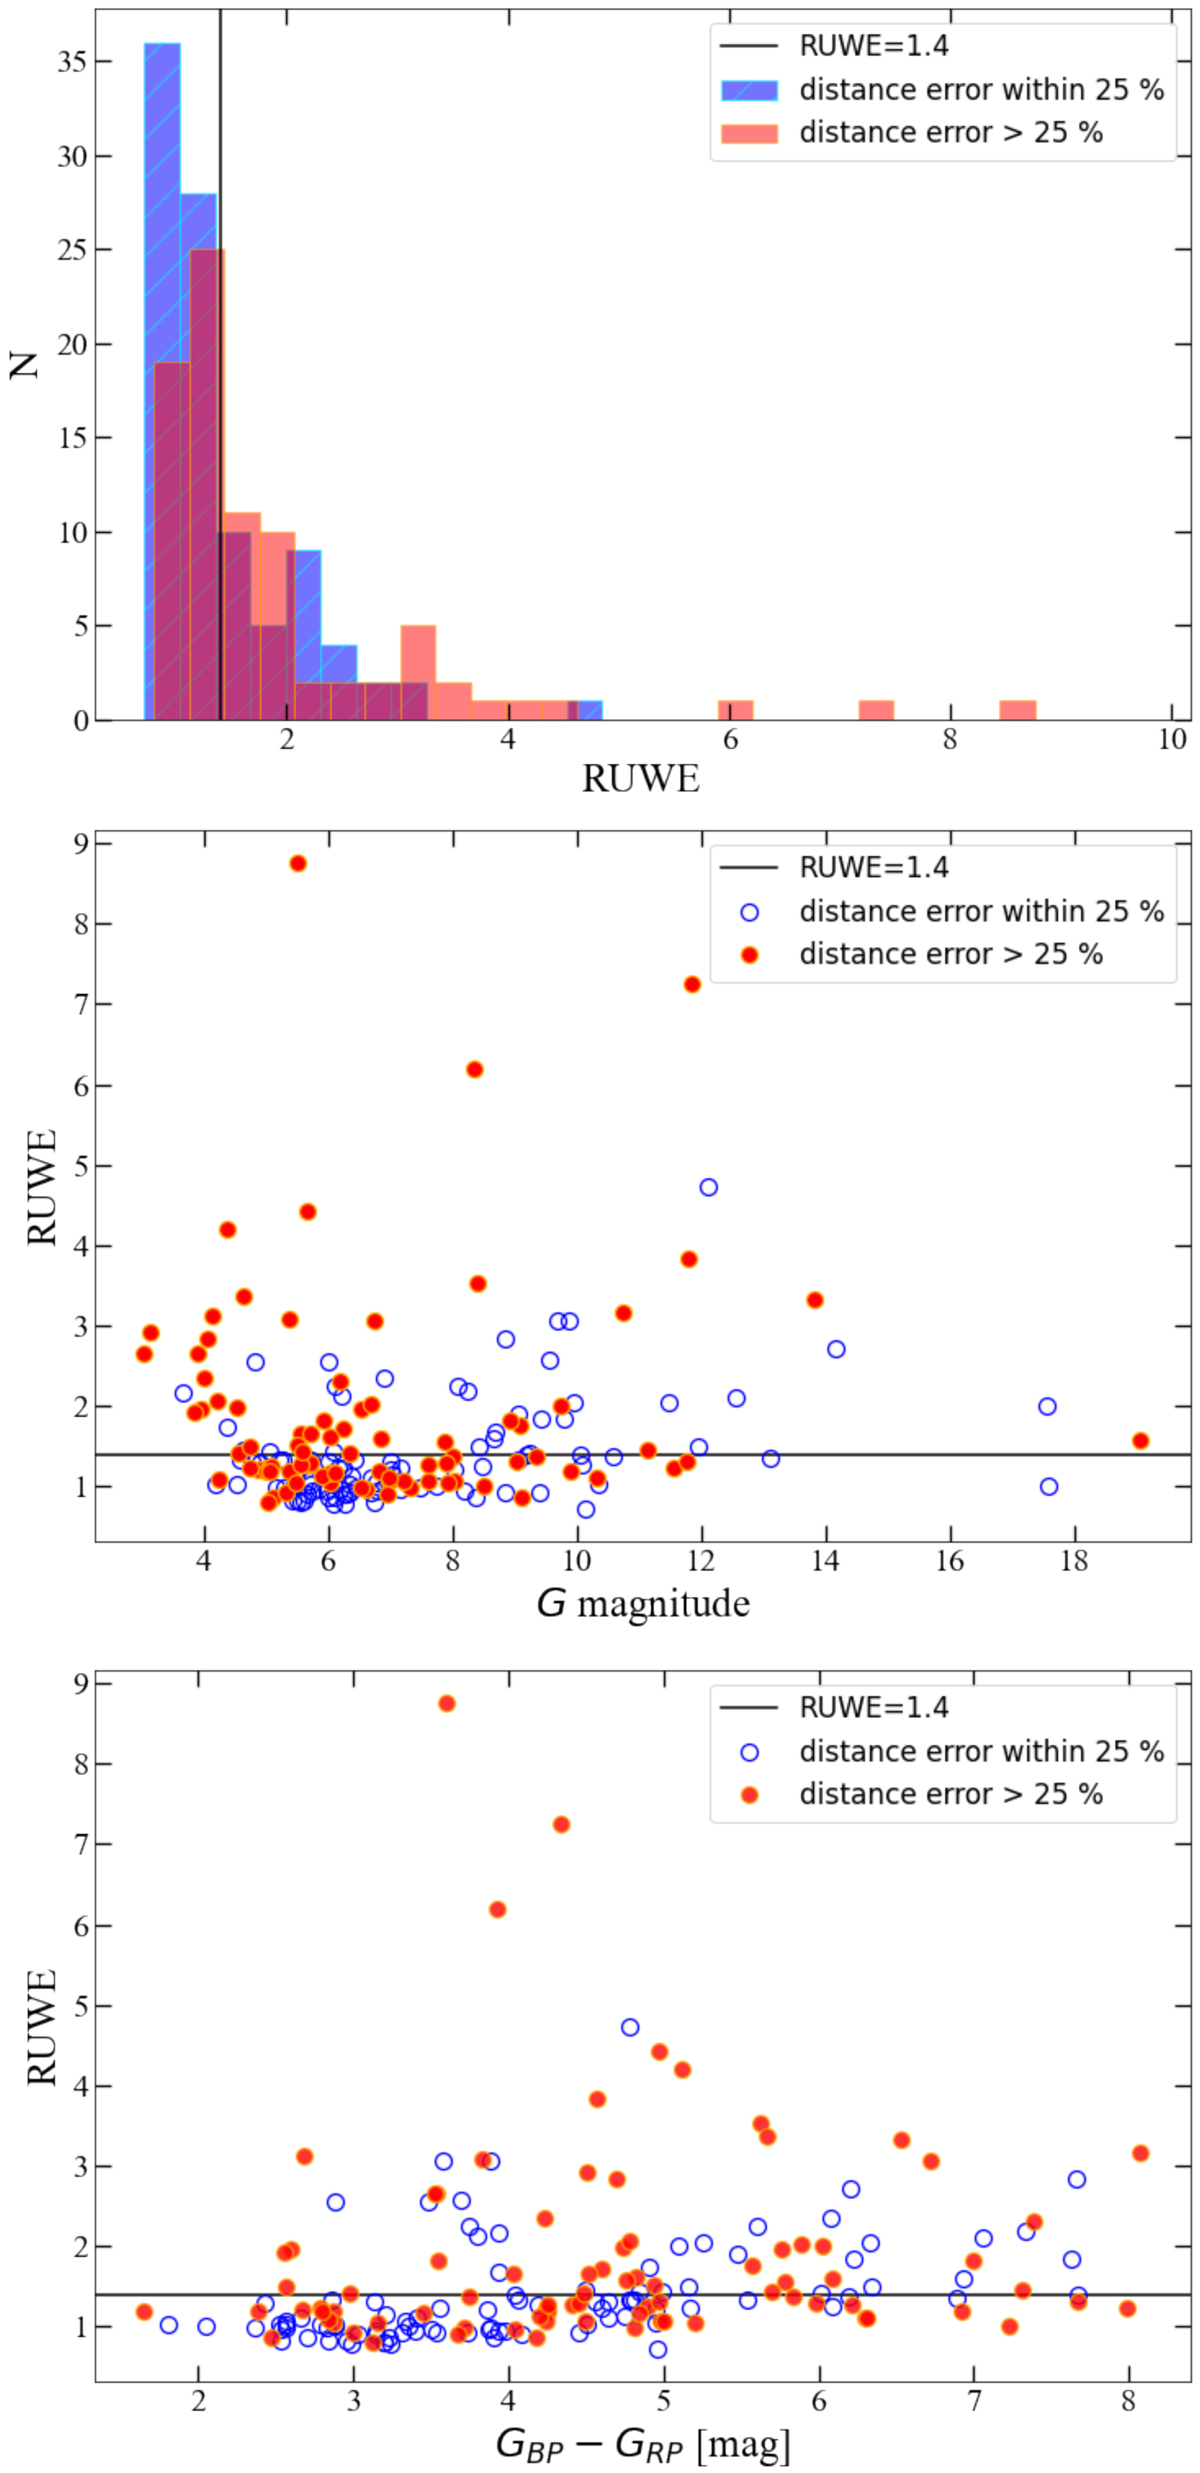
Download original image
Assessment of the RUWE criterion. Top: distribution of the RUWE of the sources in the DEATHSTAR sample for the ‘good’ (blue) and ‘bad’ (red) derived Gaia DR3 distances. Middle: RUWE of the sources in the DEATHSTAR sample as a function of G magnitude, where the blue open circles and the red full circles represent distances with fractional error within and above 25%, respectively. Bottom: RUWE of the sources in the DEATHSTAR sample as a function of colour. The symbols are the same as above.
Current usage metrics show cumulative count of Article Views (full-text article views including HTML views, PDF and ePub downloads, according to the available data) and Abstracts Views on Vision4Press platform.
Data correspond to usage on the plateform after 2015. The current usage metrics is available 48-96 hours after online publication and is updated daily on week days.
Initial download of the metrics may take a while.