Open Access
Fig. 10.
Download original image
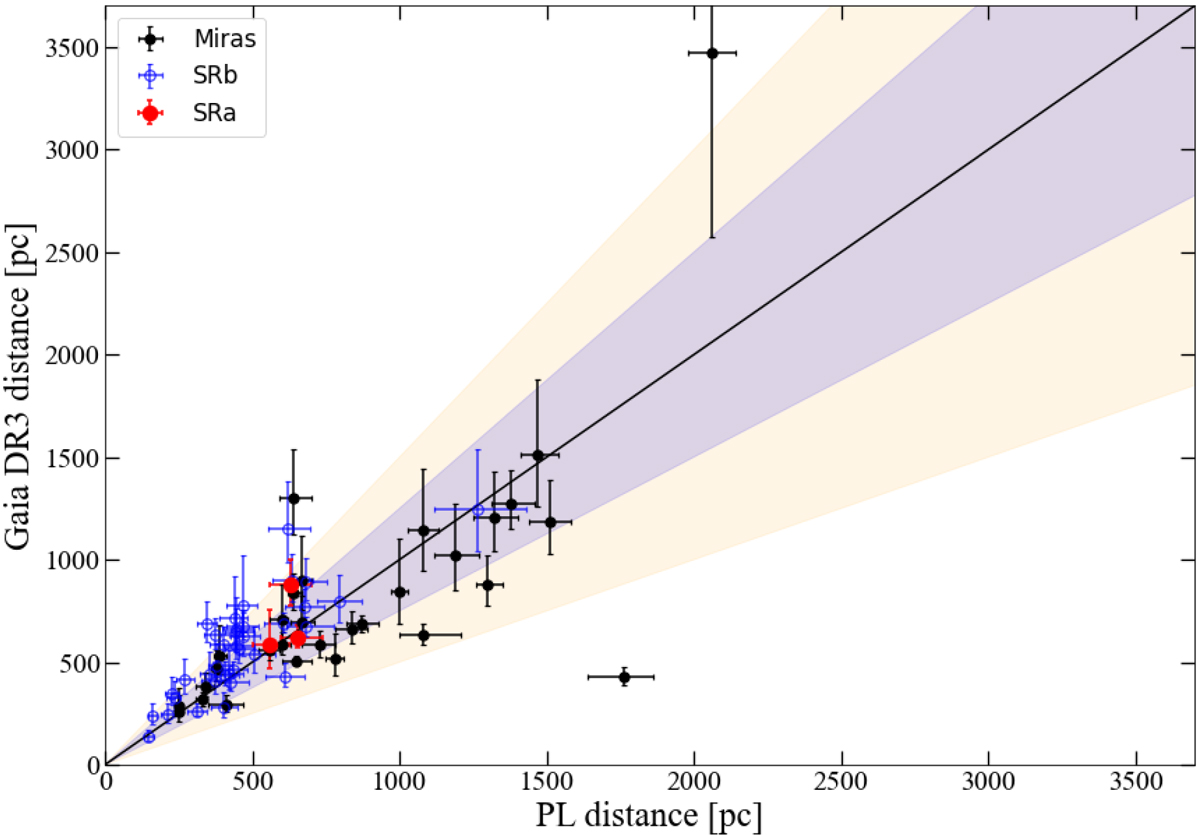
Comparison between the ‘good’ Gaia DR3 distances (see text) and the PL distances for the same sources. The black line shows the 1-to-1 relation. The blue and orange regions show the range of ±25 and ±50%, respectively.
Current usage metrics show cumulative count of Article Views (full-text article views including HTML views, PDF and ePub downloads, according to the available data) and Abstracts Views on Vision4Press platform.
Data correspond to usage on the plateform after 2015. The current usage metrics is available 48-96 hours after online publication and is updated daily on week days.
Initial download of the metrics may take a while.