Open Access
Fig. 9.
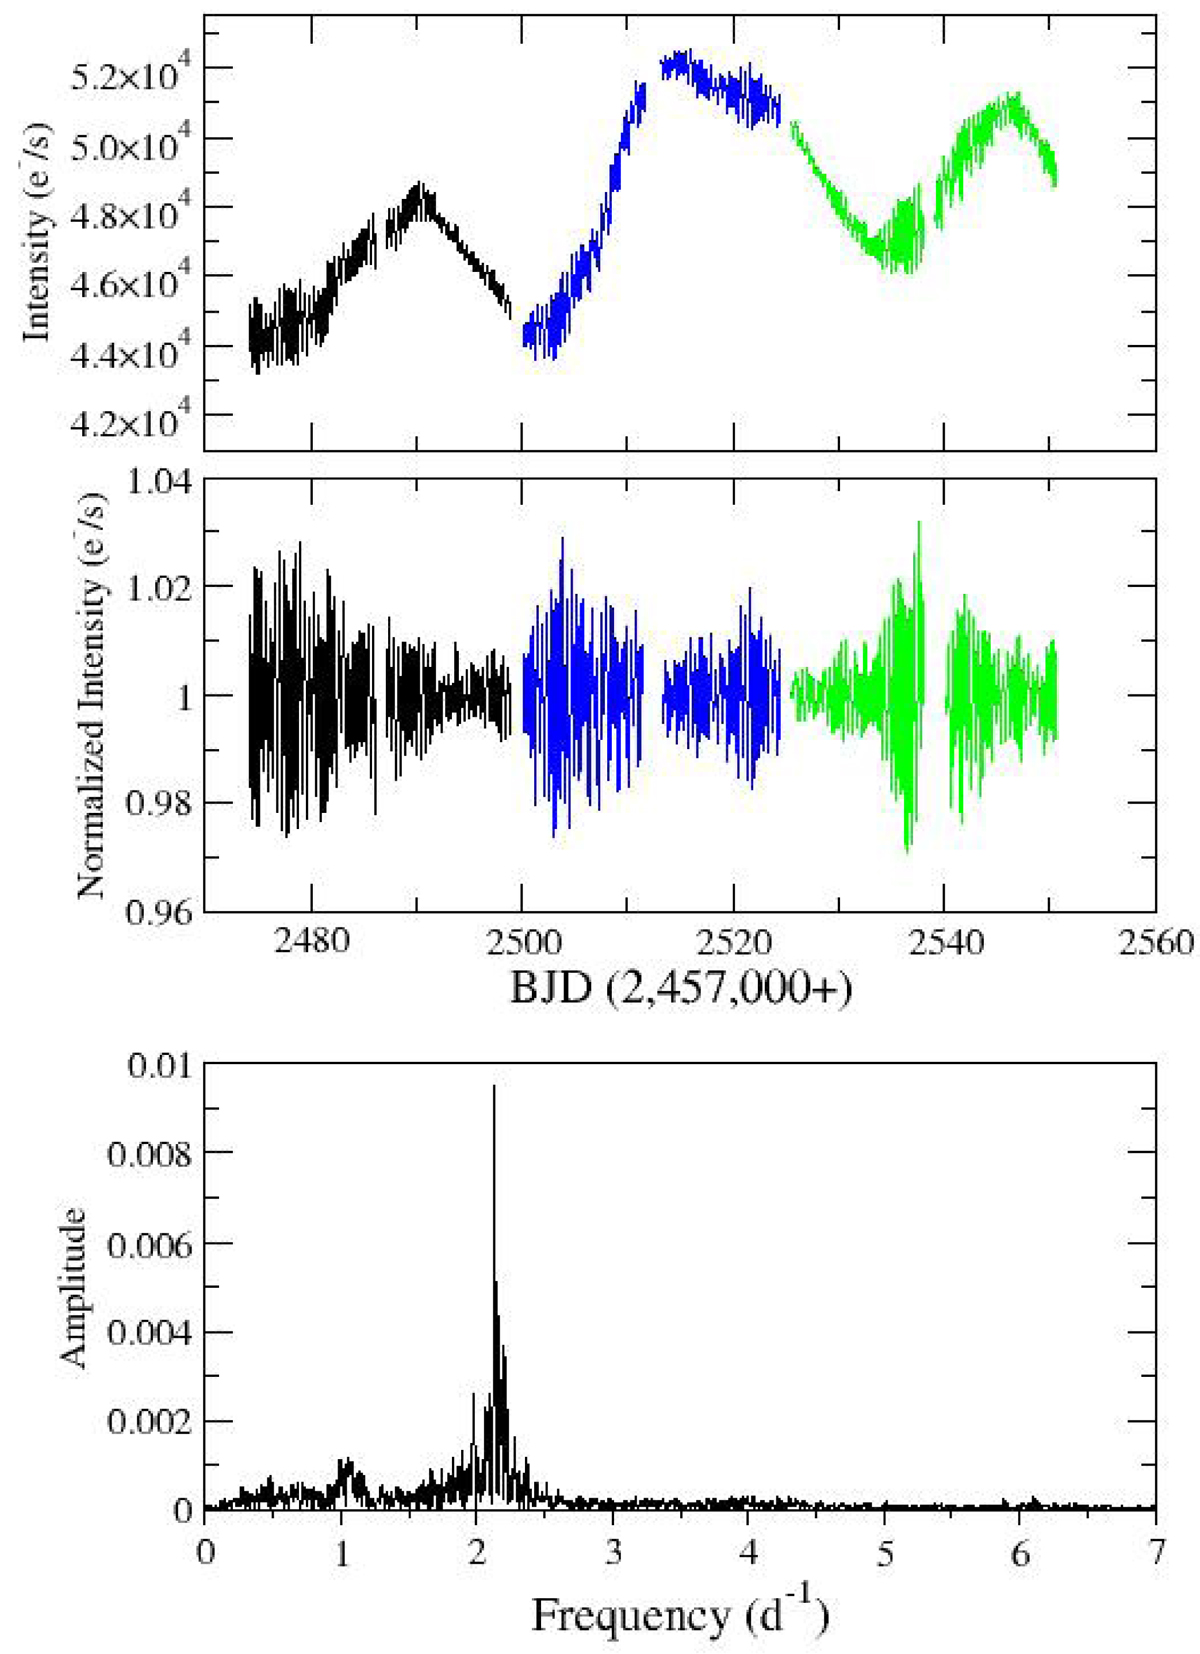
Download original image
Representative example of a star showing slow variability. Top panel: raw TESS light curve of 1A 0535+26. We use different colors for the different consecutive TESS sectors in which the star was observed. Middle panel: rectified light curve. Bottom panel: periodogram.
Current usage metrics show cumulative count of Article Views (full-text article views including HTML views, PDF and ePub downloads, according to the available data) and Abstracts Views on Vision4Press platform.
Data correspond to usage on the plateform after 2015. The current usage metrics is available 48-96 hours after online publication and is updated daily on week days.
Initial download of the metrics may take a while.