Fig. 1.
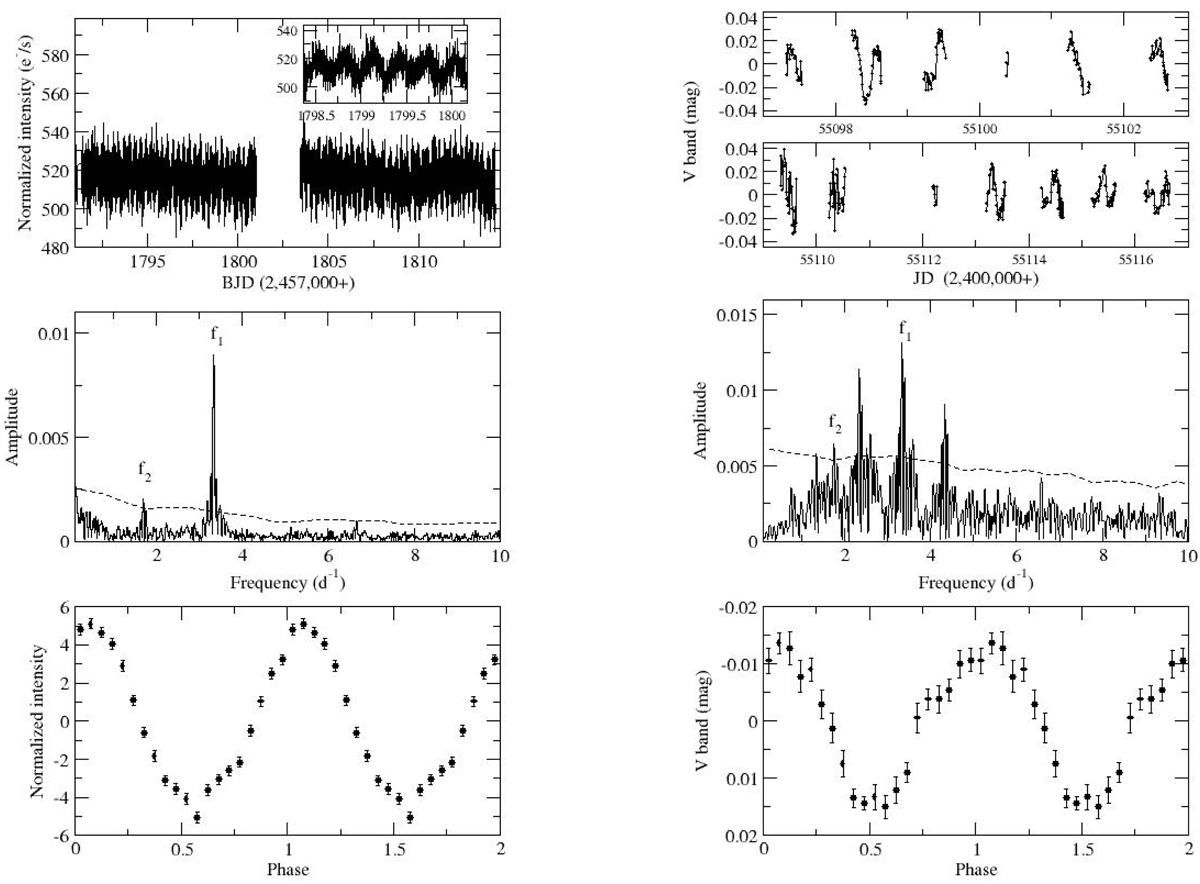
Download original image
Analysis of 4U 0115+53 performed on TESS (left) and at the SKO (right). Top panels: light curves where intra-night variability is clearly detected. Middle panels: periodograms. The dashed lines represent four times the average noise level of the final pre-whitening periodogram. The frequencies on both sides of f1 on the right panel are aliases at f1 ± 1 c d−1 and disappear after pre-whitening with f1. Bottom panels: phase diagrams folded with the 3.3 c d−1 frequency.
Current usage metrics show cumulative count of Article Views (full-text article views including HTML views, PDF and ePub downloads, according to the available data) and Abstracts Views on Vision4Press platform.
Data correspond to usage on the plateform after 2015. The current usage metrics is available 48-96 hours after online publication and is updated daily on week days.
Initial download of the metrics may take a while.