Fig. 8
Download original image
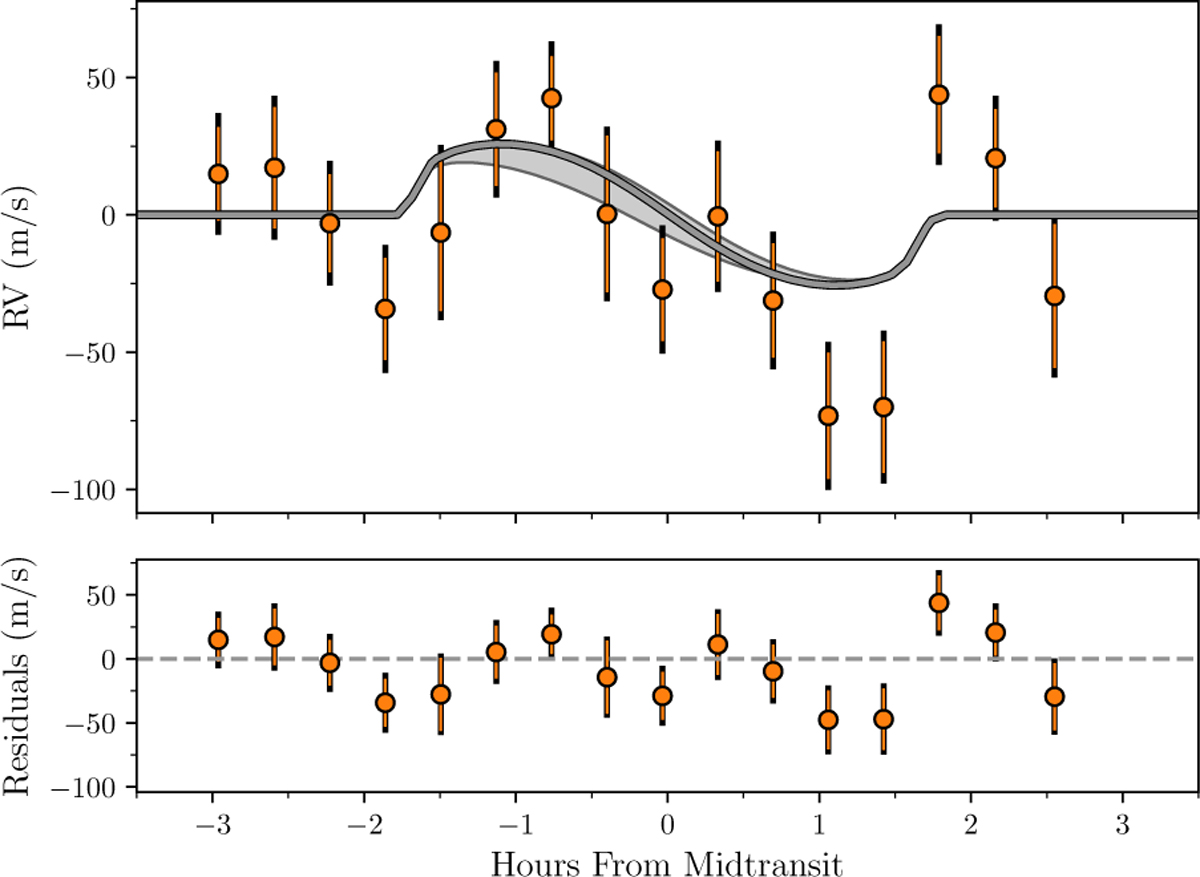
Rossiter-McLaughlin effect in TOI-2025. Our in-transit observations of TOI-2025 with FIES+. Top: Keplerian orbit and quadratic trend has been subtracted from the RVs to better show the RM effect, with the grey line being the best-fitting model. The shaded area denotes the confidence interval in the projected obliquity, ![]() . Bottom: here we have further subtracted this best-fitting model from the RVs.
. Bottom: here we have further subtracted this best-fitting model from the RVs.
Current usage metrics show cumulative count of Article Views (full-text article views including HTML views, PDF and ePub downloads, according to the available data) and Abstracts Views on Vision4Press platform.
Data correspond to usage on the plateform after 2015. The current usage metrics is available 48-96 hours after online publication and is updated daily on week days.
Initial download of the metrics may take a while.