Fig. 6
Download original image
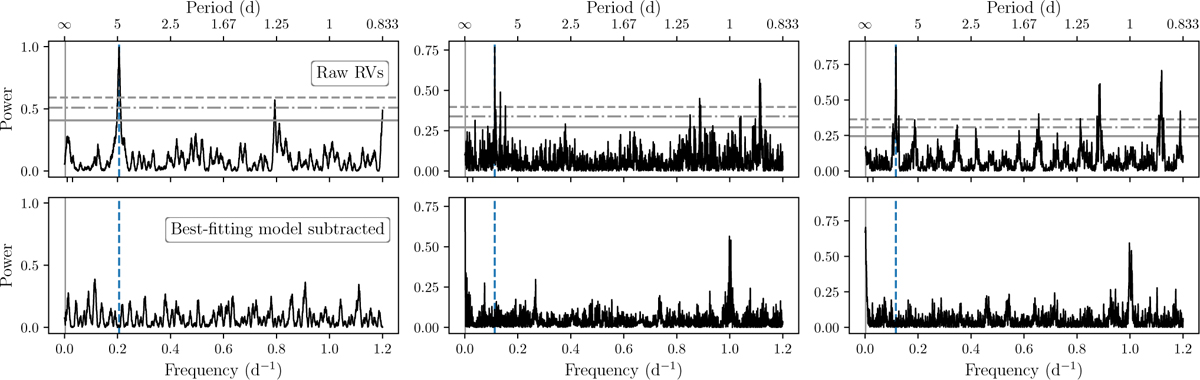
Generalised Lomb-Scargle periodograms. From left to right are the GLS periodograms for TOI-1820, TOI-2025, and TOI-2158. In the top row, we show the GLS periodograms directly from the RVs, and in the bottom we have removed the orbit of the planet. The vertical dashed lines from left to right denote the 4.9 d, 8.9 d, and 8.6 d signals seen in the photometry for TOI-1820, TOI-2025, and TOI-2158, respectively. The solid lines are our baselines, i.e. 1/(tlast RV − tfirst rv) with tfirst rv and tlast rv being the times for the first and last acquired RVs. The horizontal solid, dot-dashed, and dashed lines show the 10, 1, and 0.1% false alarm probabilities, respectively.
Current usage metrics show cumulative count of Article Views (full-text article views including HTML views, PDF and ePub downloads, according to the available data) and Abstracts Views on Vision4Press platform.
Data correspond to usage on the plateform after 2015. The current usage metrics is available 48-96 hours after online publication and is updated daily on week days.
Initial download of the metrics may take a while.