Fig. 5
Download original image
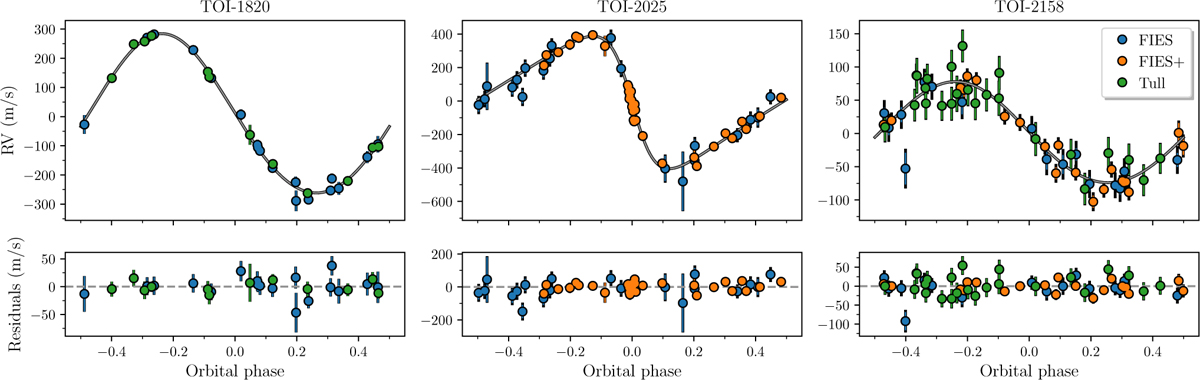
Radial velocities. From left to right are our FIES (blue), FIES+ (orange), and Tull (green) RVs for TOI-1820, TOI-2025, and TOI-2158, respectively, where the black parts of the error bars denote the jitter added in quadrature. The grey curves are the best-fitting models. In the bottom row are the residuals after subtracting the best-fitting models.
Current usage metrics show cumulative count of Article Views (full-text article views including HTML views, PDF and ePub downloads, according to the available data) and Abstracts Views on Vision4Press platform.
Data correspond to usage on the plateform after 2015. The current usage metrics is available 48-96 hours after online publication and is updated daily on week days.
Initial download of the metrics may take a while.