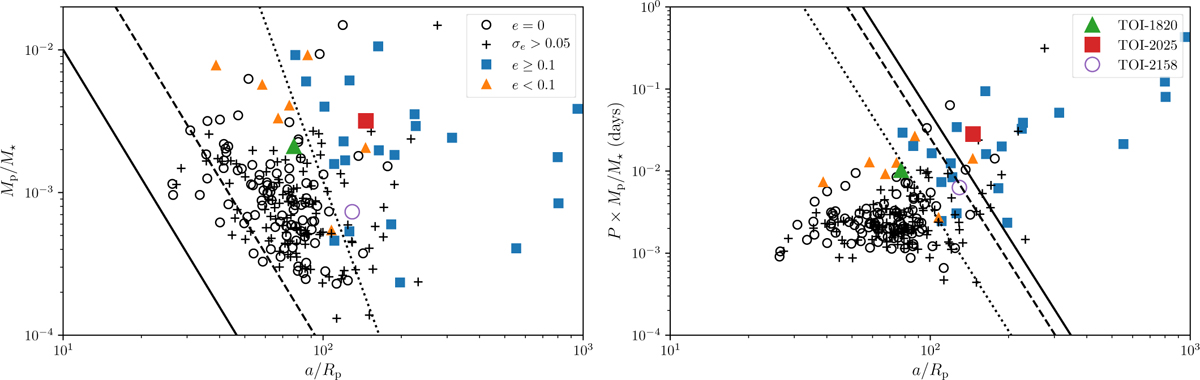
Fig. 13
Download original image
Tidal diagrams. Tidal diagrams for transiting giant planets from Bonomo et al. (2017a). Open circles denote planets on circular orbits with σe < 0.05. Markers shown with pluses are planets with undertermined eccentrities, i.e. σe > 0.05. Most of these are consistent with e = 0. Triangles represent planets with significant, but small eccentricities e < 0.1, and squares are eccentric systems ≥0.1. Adhering to this notation we have shown the planets in our sample with the corresponding marker. However, we have colour coded them for clarity. Created from the catalogue Bonomo et al. (2017b). Left. Tidal diagram: solid and dashed lines show the position of a planet with a separation of a = aR and a = 2aR, respectively (aR being the Roche limit), and radius Rp = 1.2 RJ. The dotted line is a circularisation isochrone for a planet with P = 3 d, Q′p = 106, and e = 0. It should be noted that Eq. (1) in Bonomo et al. (2017a) used to create the dotted line should have π in the numerator instead of the denominator (A. S. Bonomo priv. comm.). Right. Modified tidal diagram: dotted, dashed, and solid lines denote the 1, 7, and 14 Gyr circularisation timescales, respectively, assuming e = 0 and Q′p = 106.
Current usage metrics show cumulative count of Article Views (full-text article views including HTML views, PDF and ePub downloads, according to the available data) and Abstracts Views on Vision4Press platform.
Data correspond to usage on the plateform after 2015. The current usage metrics is available 48-96 hours after online publication and is updated daily on week days.
Initial download of the metrics may take a while.