Open Access
Fig. 4.
Download original image
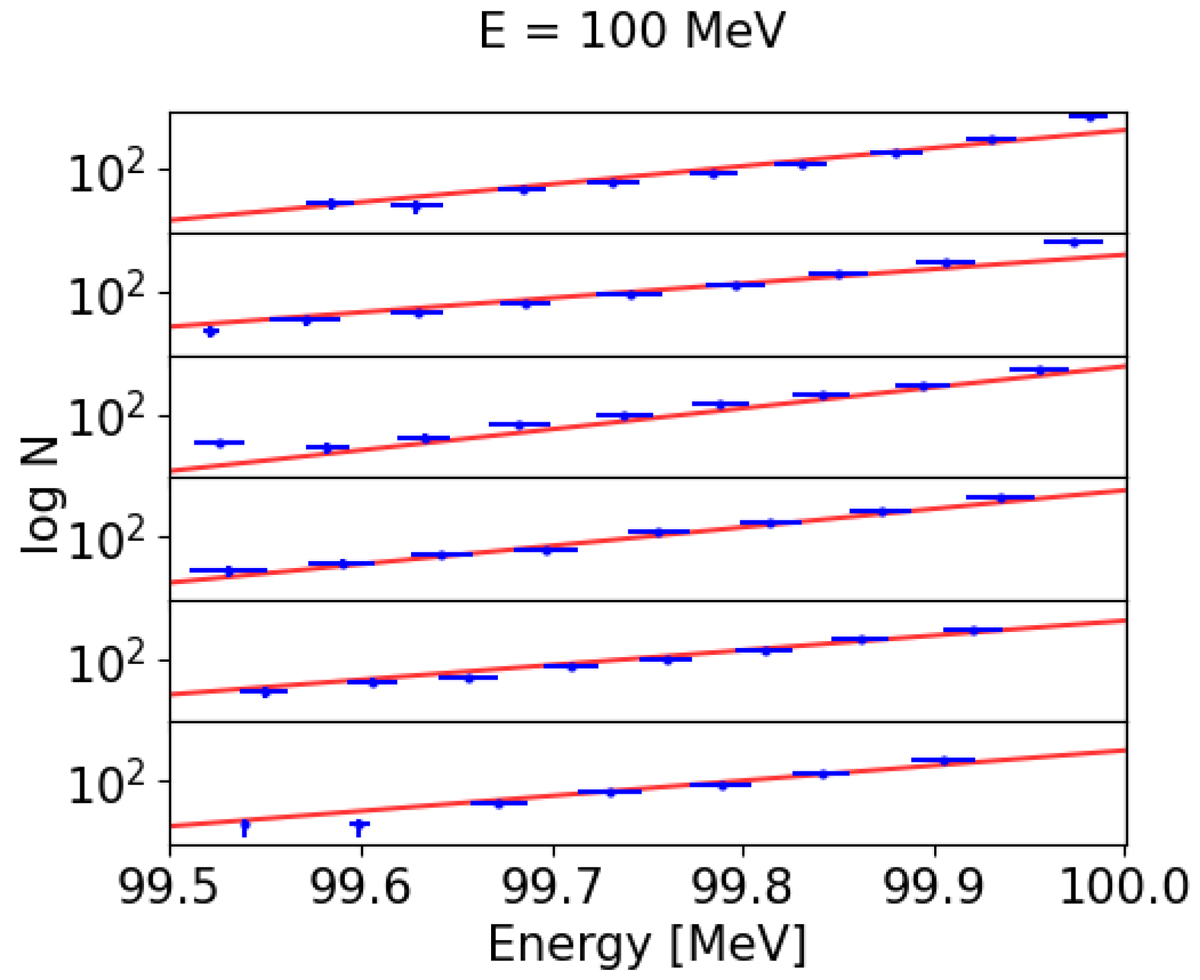
Histogram of 100 MeV protons propagating in a uniform medium. The top plot represents the particles on the injection face reflected by the medium. The middle plots are at increasing depth, and the bottom represents transmission. The red lines show a power-law fit of the particle distributions.
Current usage metrics show cumulative count of Article Views (full-text article views including HTML views, PDF and ePub downloads, according to the available data) and Abstracts Views on Vision4Press platform.
Data correspond to usage on the plateform after 2015. The current usage metrics is available 48-96 hours after online publication and is updated daily on week days.
Initial download of the metrics may take a while.