Fig. 13.
Download original image
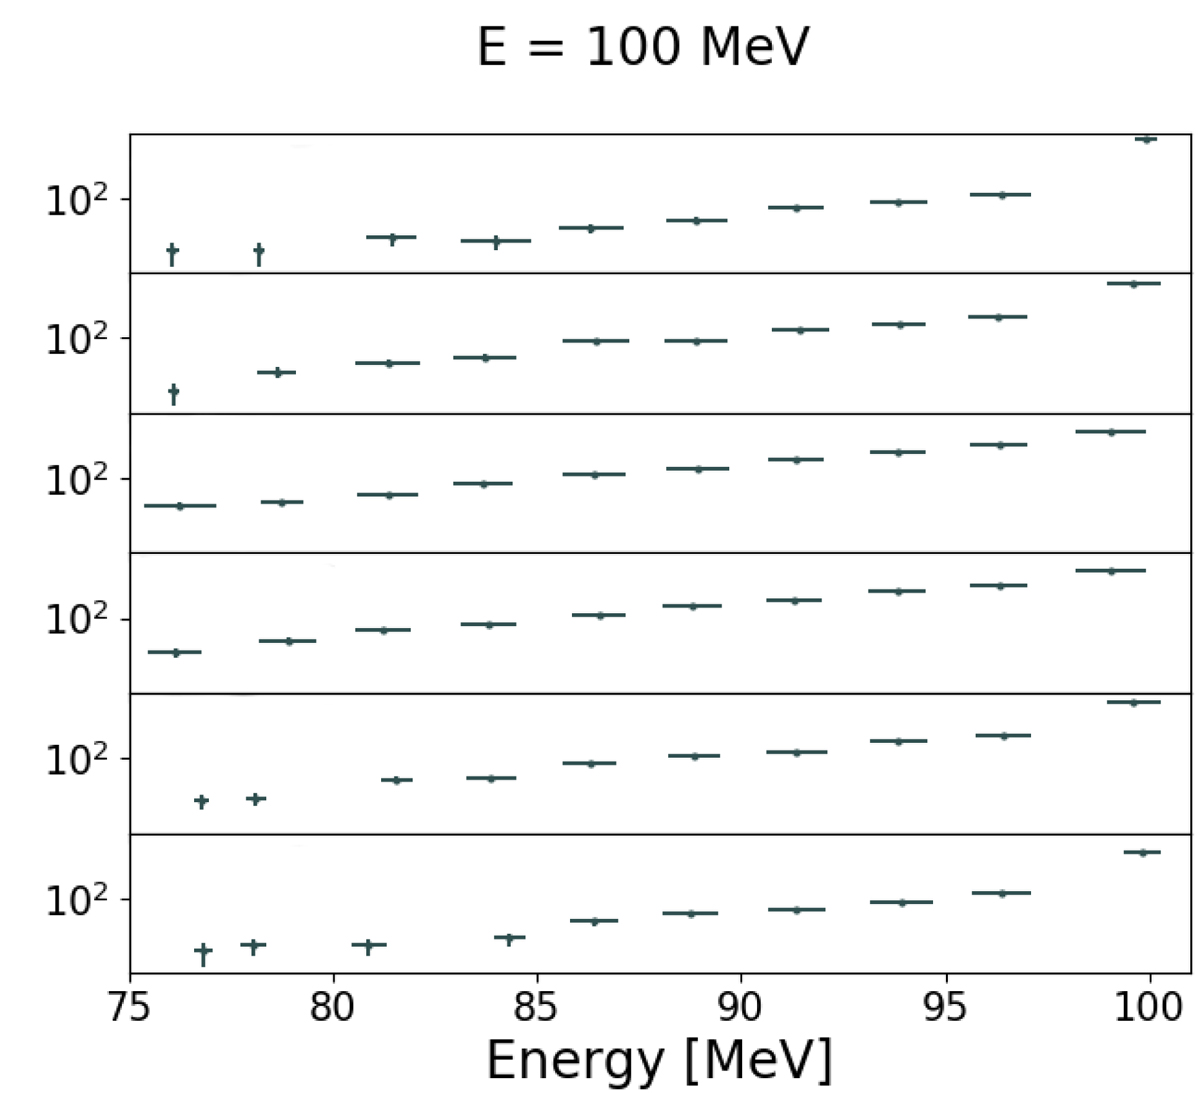
Histogram of 100 MeV protons propagating in a stratified medium: Morlino et al. (2015) model. The top two and bottom two plots refer to the diffuse region, n = 100 cm−3, and the third and fourth plots are for the dense embedded region, n = 300 cm−3. Note that in the top and bottom panel, which show the distribution in the external medium, the low-energy flat spectrum is from protons that escape after partial trapping in the denser stratum. See also Figs. 7 and 8.
Current usage metrics show cumulative count of Article Views (full-text article views including HTML views, PDF and ePub downloads, according to the available data) and Abstracts Views on Vision4Press platform.
Data correspond to usage on the plateform after 2015. The current usage metrics is available 48-96 hours after online publication and is updated daily on week days.
Initial download of the metrics may take a while.