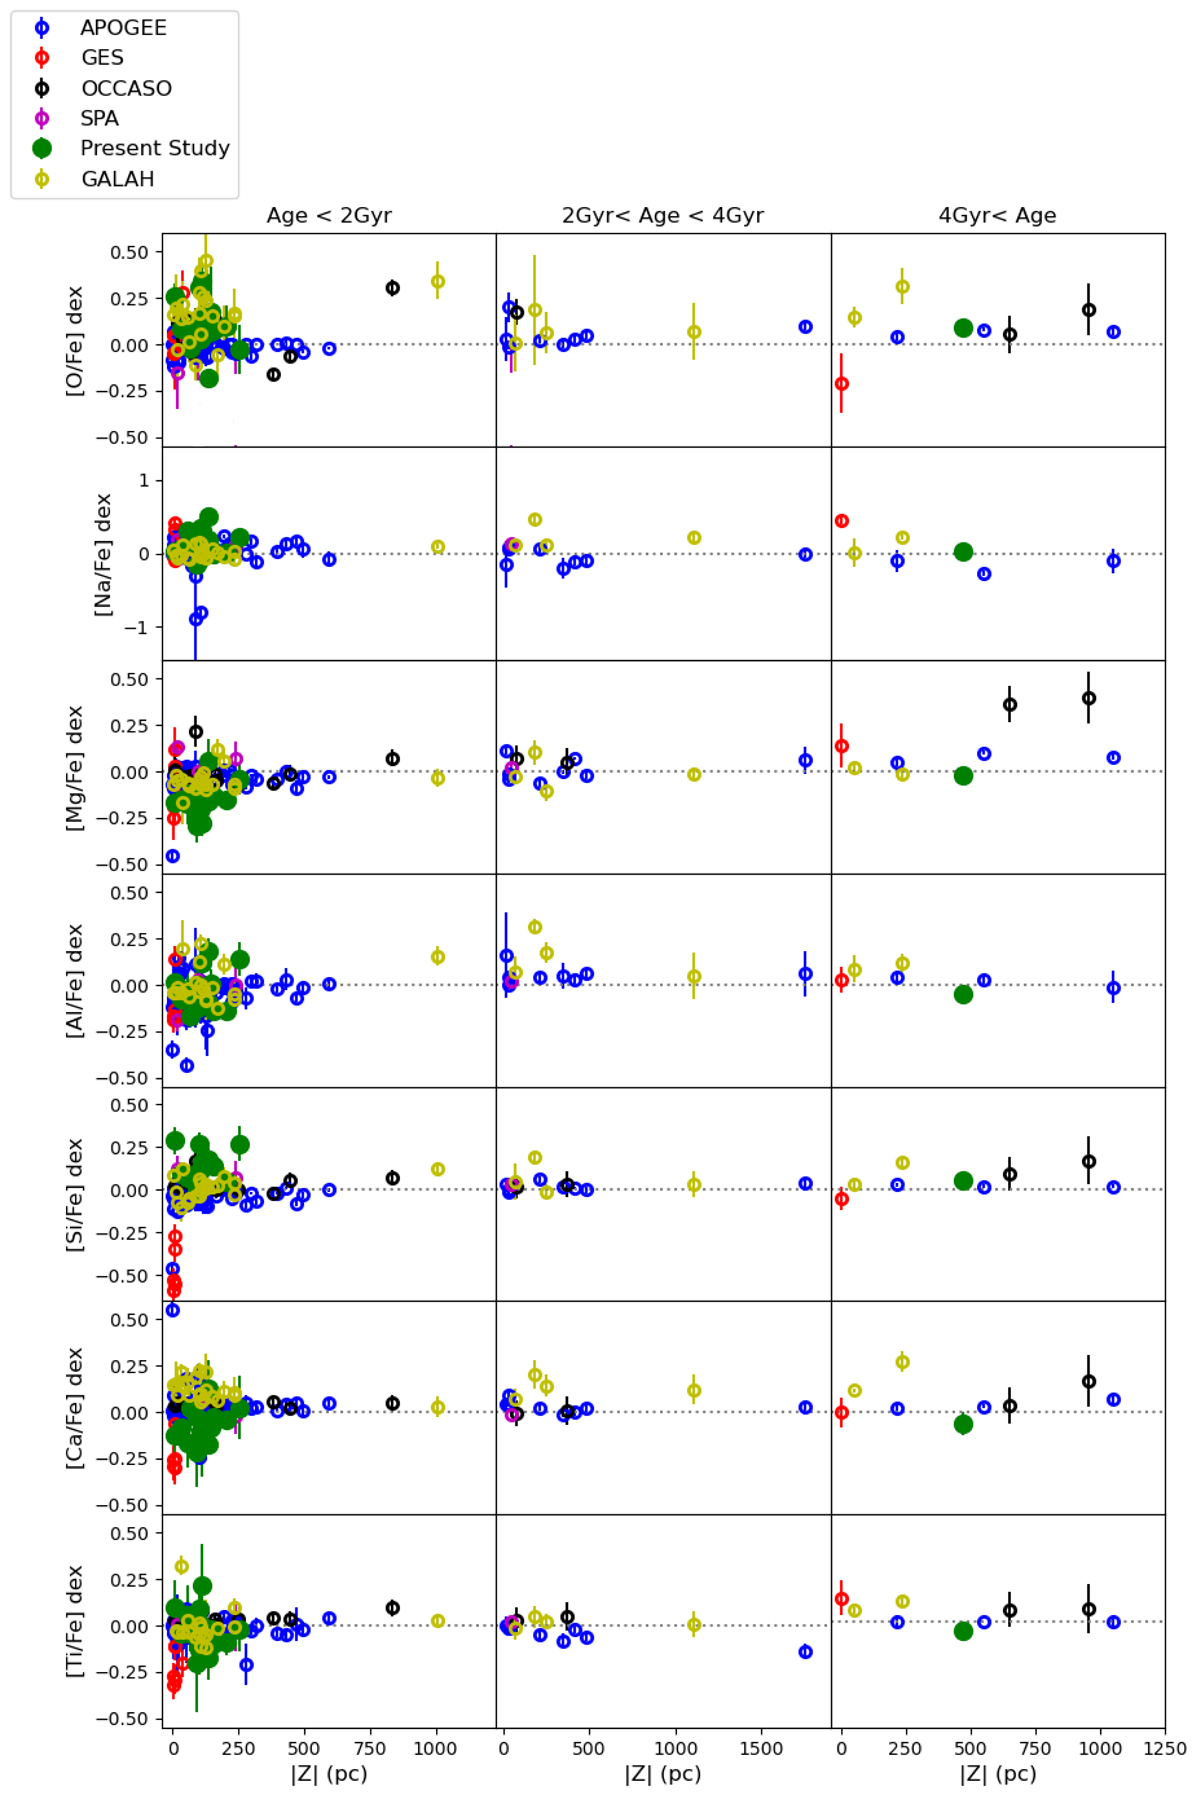
Fig. 9.
Download original image
Distribution of abundance ratios with distance from mid-plate in three age bins. Besides our clusters, we show data from the APOGEE DR16 (Donor et al. 2020), GES (Casali et al. 2019), OCCASO (Casamiquela et al. 2019), and GALAH (Spina et al. 2021) plus SPA results already published (Frasca et al. 2019; Casali et al. 2020; D’Orazi et al. 2020).
Current usage metrics show cumulative count of Article Views (full-text article views including HTML views, PDF and ePub downloads, according to the available data) and Abstracts Views on Vision4Press platform.
Data correspond to usage on the plateform after 2015. The current usage metrics is available 48-96 hours after online publication and is updated daily on week days.
Initial download of the metrics may take a while.