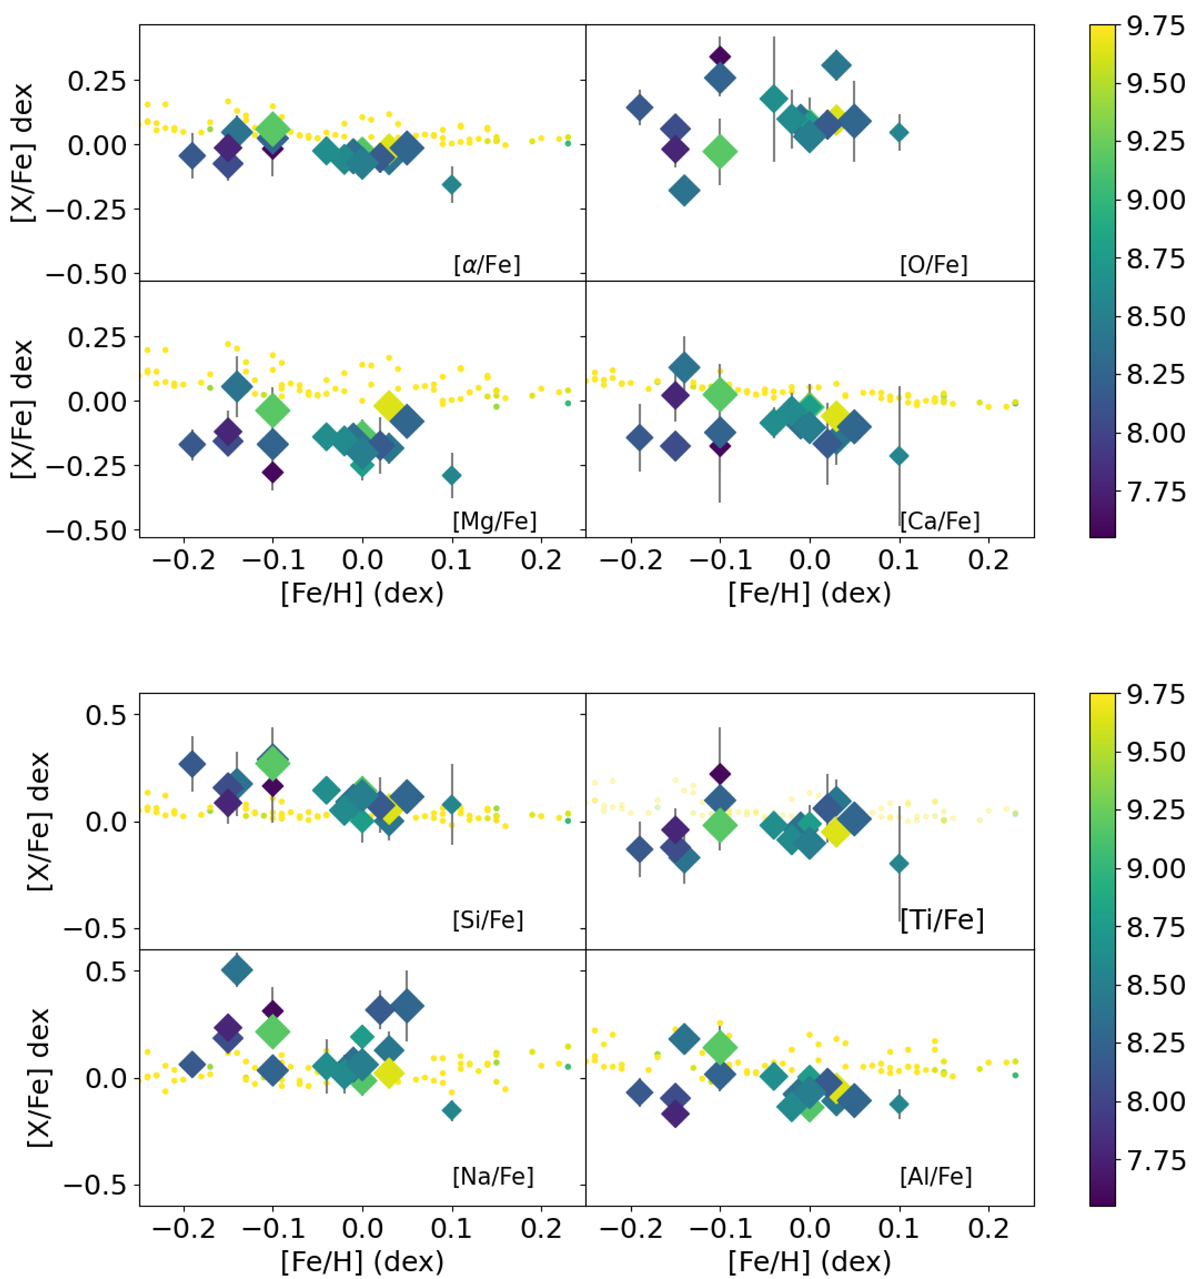
Fig. 6.
Download original image
Relationships between [Fe/H], the α elements (including [α/Fe] defined as the average of Mg, Ca, Si, and Ti indexed against Fe), Na, and Al, colored by log (Age) and sized by Rgc; the larger one is the sample with the longer Rgc. The small dots are for the HARPS-GTO samples. The O abundances are not available for the HARPS-GTO sample. The relationships between [Fe/H] and [Na/Fe] and [Al/Fe] are colored by log (Age). The small dots are for the HARPS-GTO samples.
Current usage metrics show cumulative count of Article Views (full-text article views including HTML views, PDF and ePub downloads, according to the available data) and Abstracts Views on Vision4Press platform.
Data correspond to usage on the plateform after 2015. The current usage metrics is available 48-96 hours after online publication and is updated daily on week days.
Initial download of the metrics may take a while.